Kontrollera FläktWoods FTX ventilation med Home Assistant (swedish version)

Denna artikel beskriver hur man kan ansluta till FläktWoords FTX ventilation till sin Home Assistant installation.

Bakgrund

Jag har nyligen flyttat till ett hus med ett RDAF midi FTX aggregat från FläktWoods med kontrollpanelen CURO Touch RDKZ-41-3 som tillbehör. När jag klickade runt i menyerna på kontrollpanelen insåg jag att det fanns en del inställningar för modbus vilket gjorde mig nyfiken. Dessutom insåg jag ganska snabbt att det vore en stor fördel att kunna styra aggregatet på distans. Dels för att styra börvärden, men också för att automatisera detta. Till exempel när huset värmts upp under en varm sommardag, då vill man gärna kunna ställa ner börvärdet på tilluften alternativt stänga av värmeåtervinningen helt. På vintern däremot vill man gärna maximera värmeåtervinningen och kanske dra ner på flödet riktigt kalla dagar.

Modbus på FTX-aggregatet

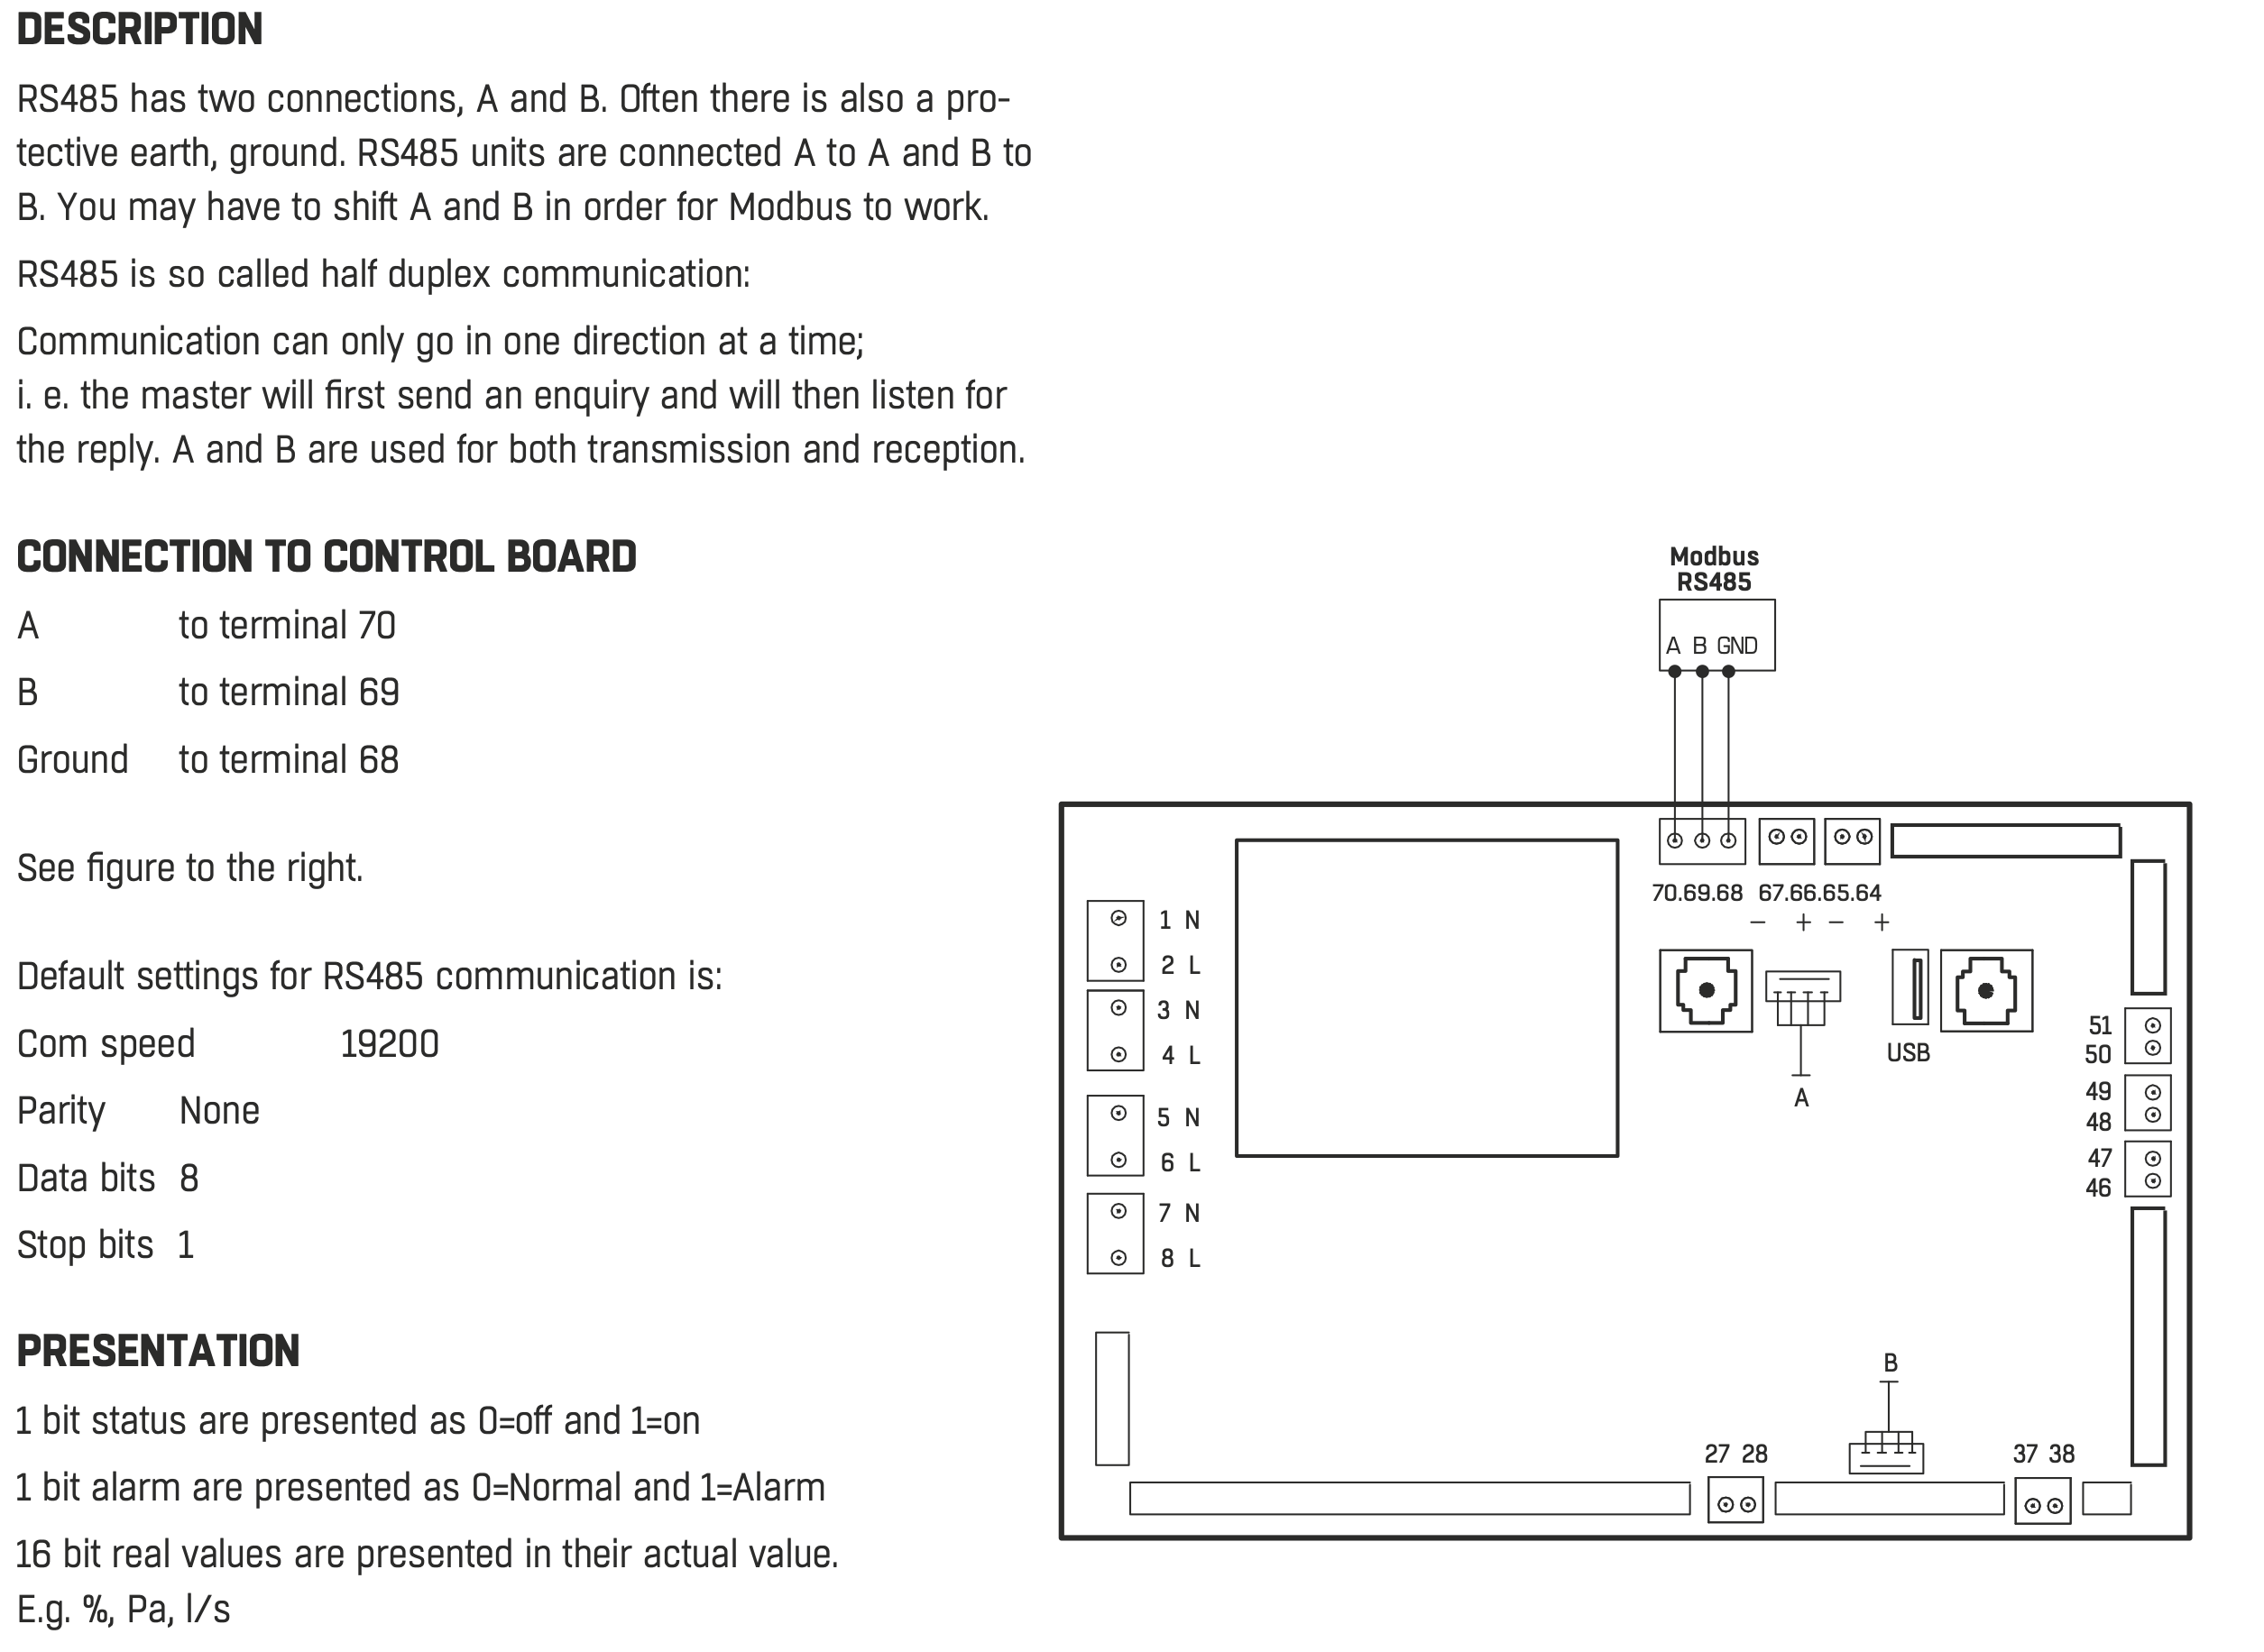
Efter lite letande på FläktGroups webplats hittade jag dokumentation för aggregatet och styrkortet som visade att det fanns utgång för modbus (RS485).

Efter lite mer forskande och kontakt med supporten fick jag faktiskt hemskickat den skruvplint som passade för styrkortet.
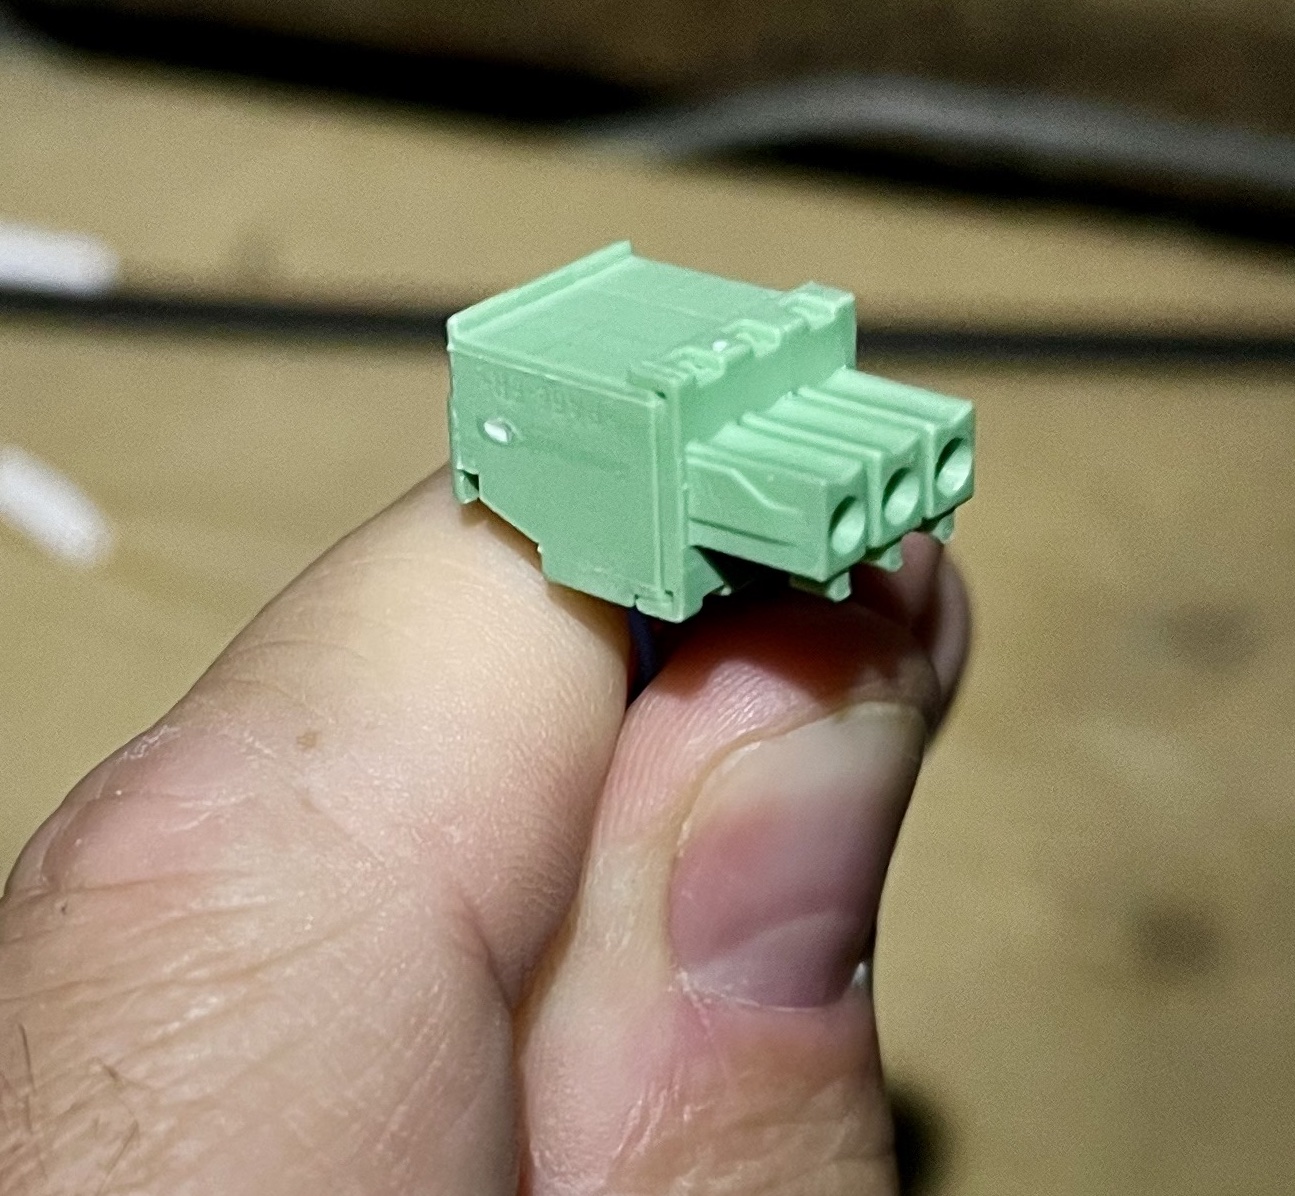
Skruvplint

Skruvplint

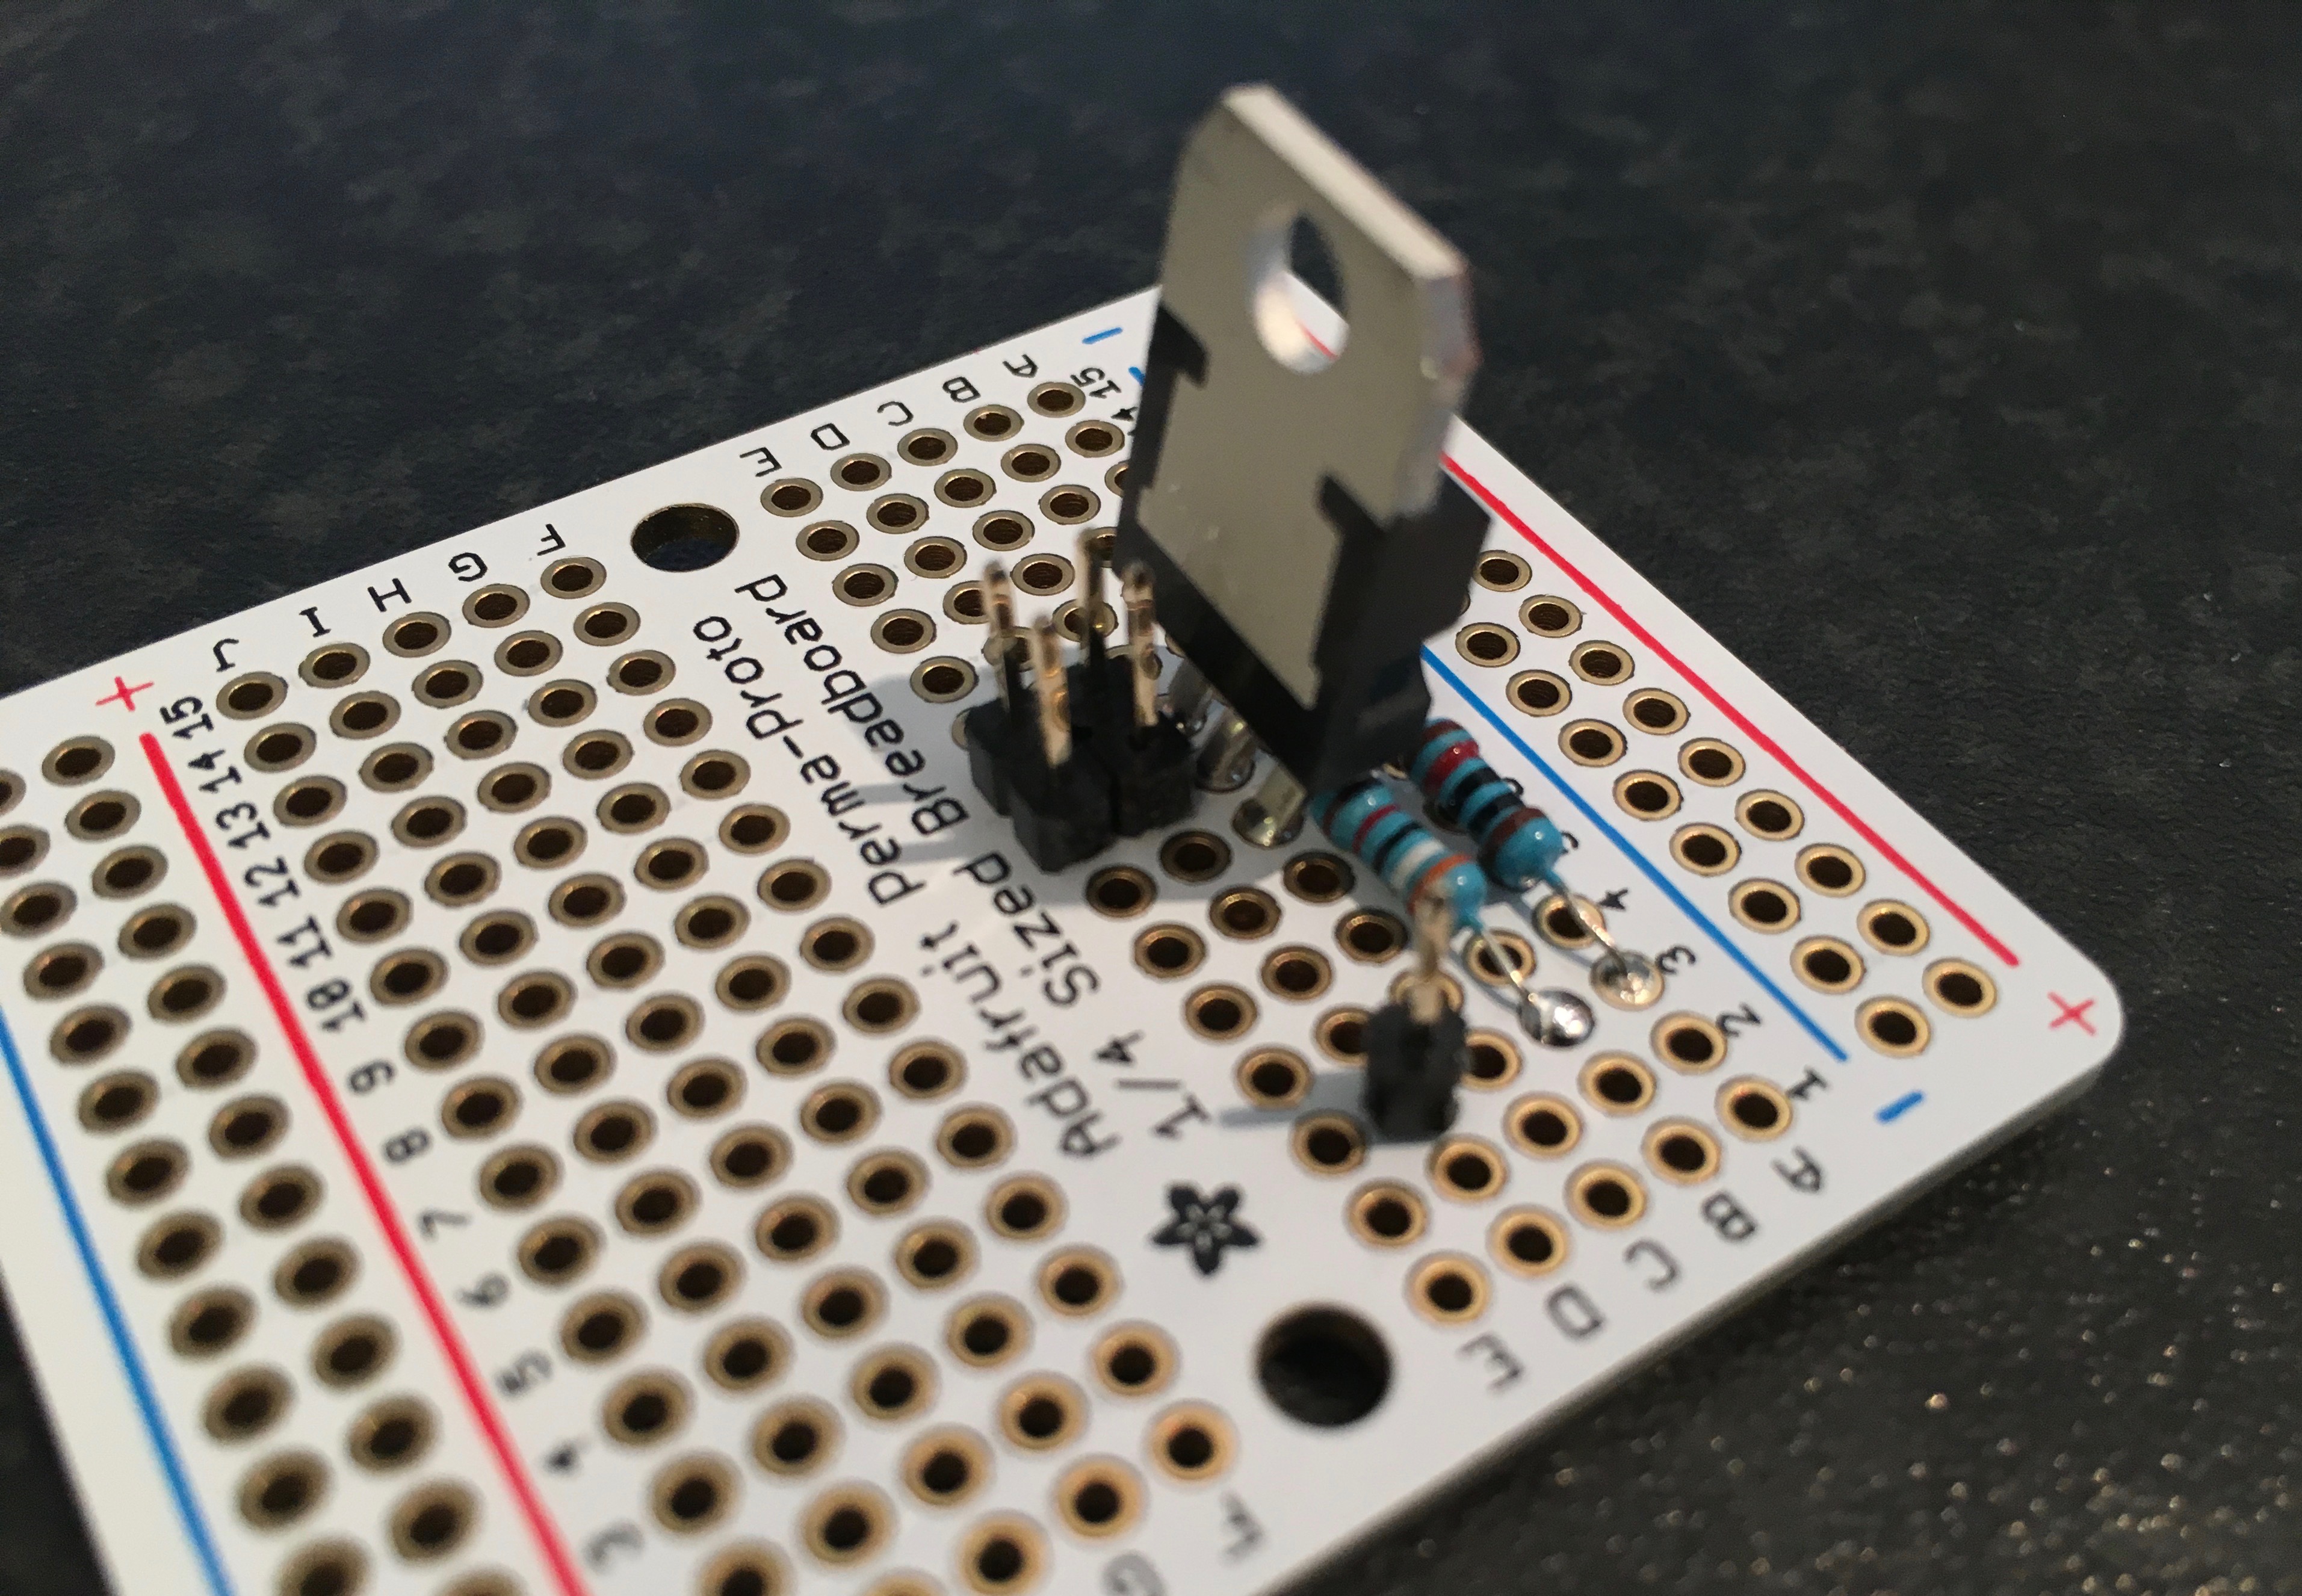
Efter det så tittade jag fysiskt på aggregatet och hittade styrkortet och den aktuella porten.  Orienteringen på kortet var lite annorlunda med anslutningsnummer 70,69,68 stämde med dokumentationen.
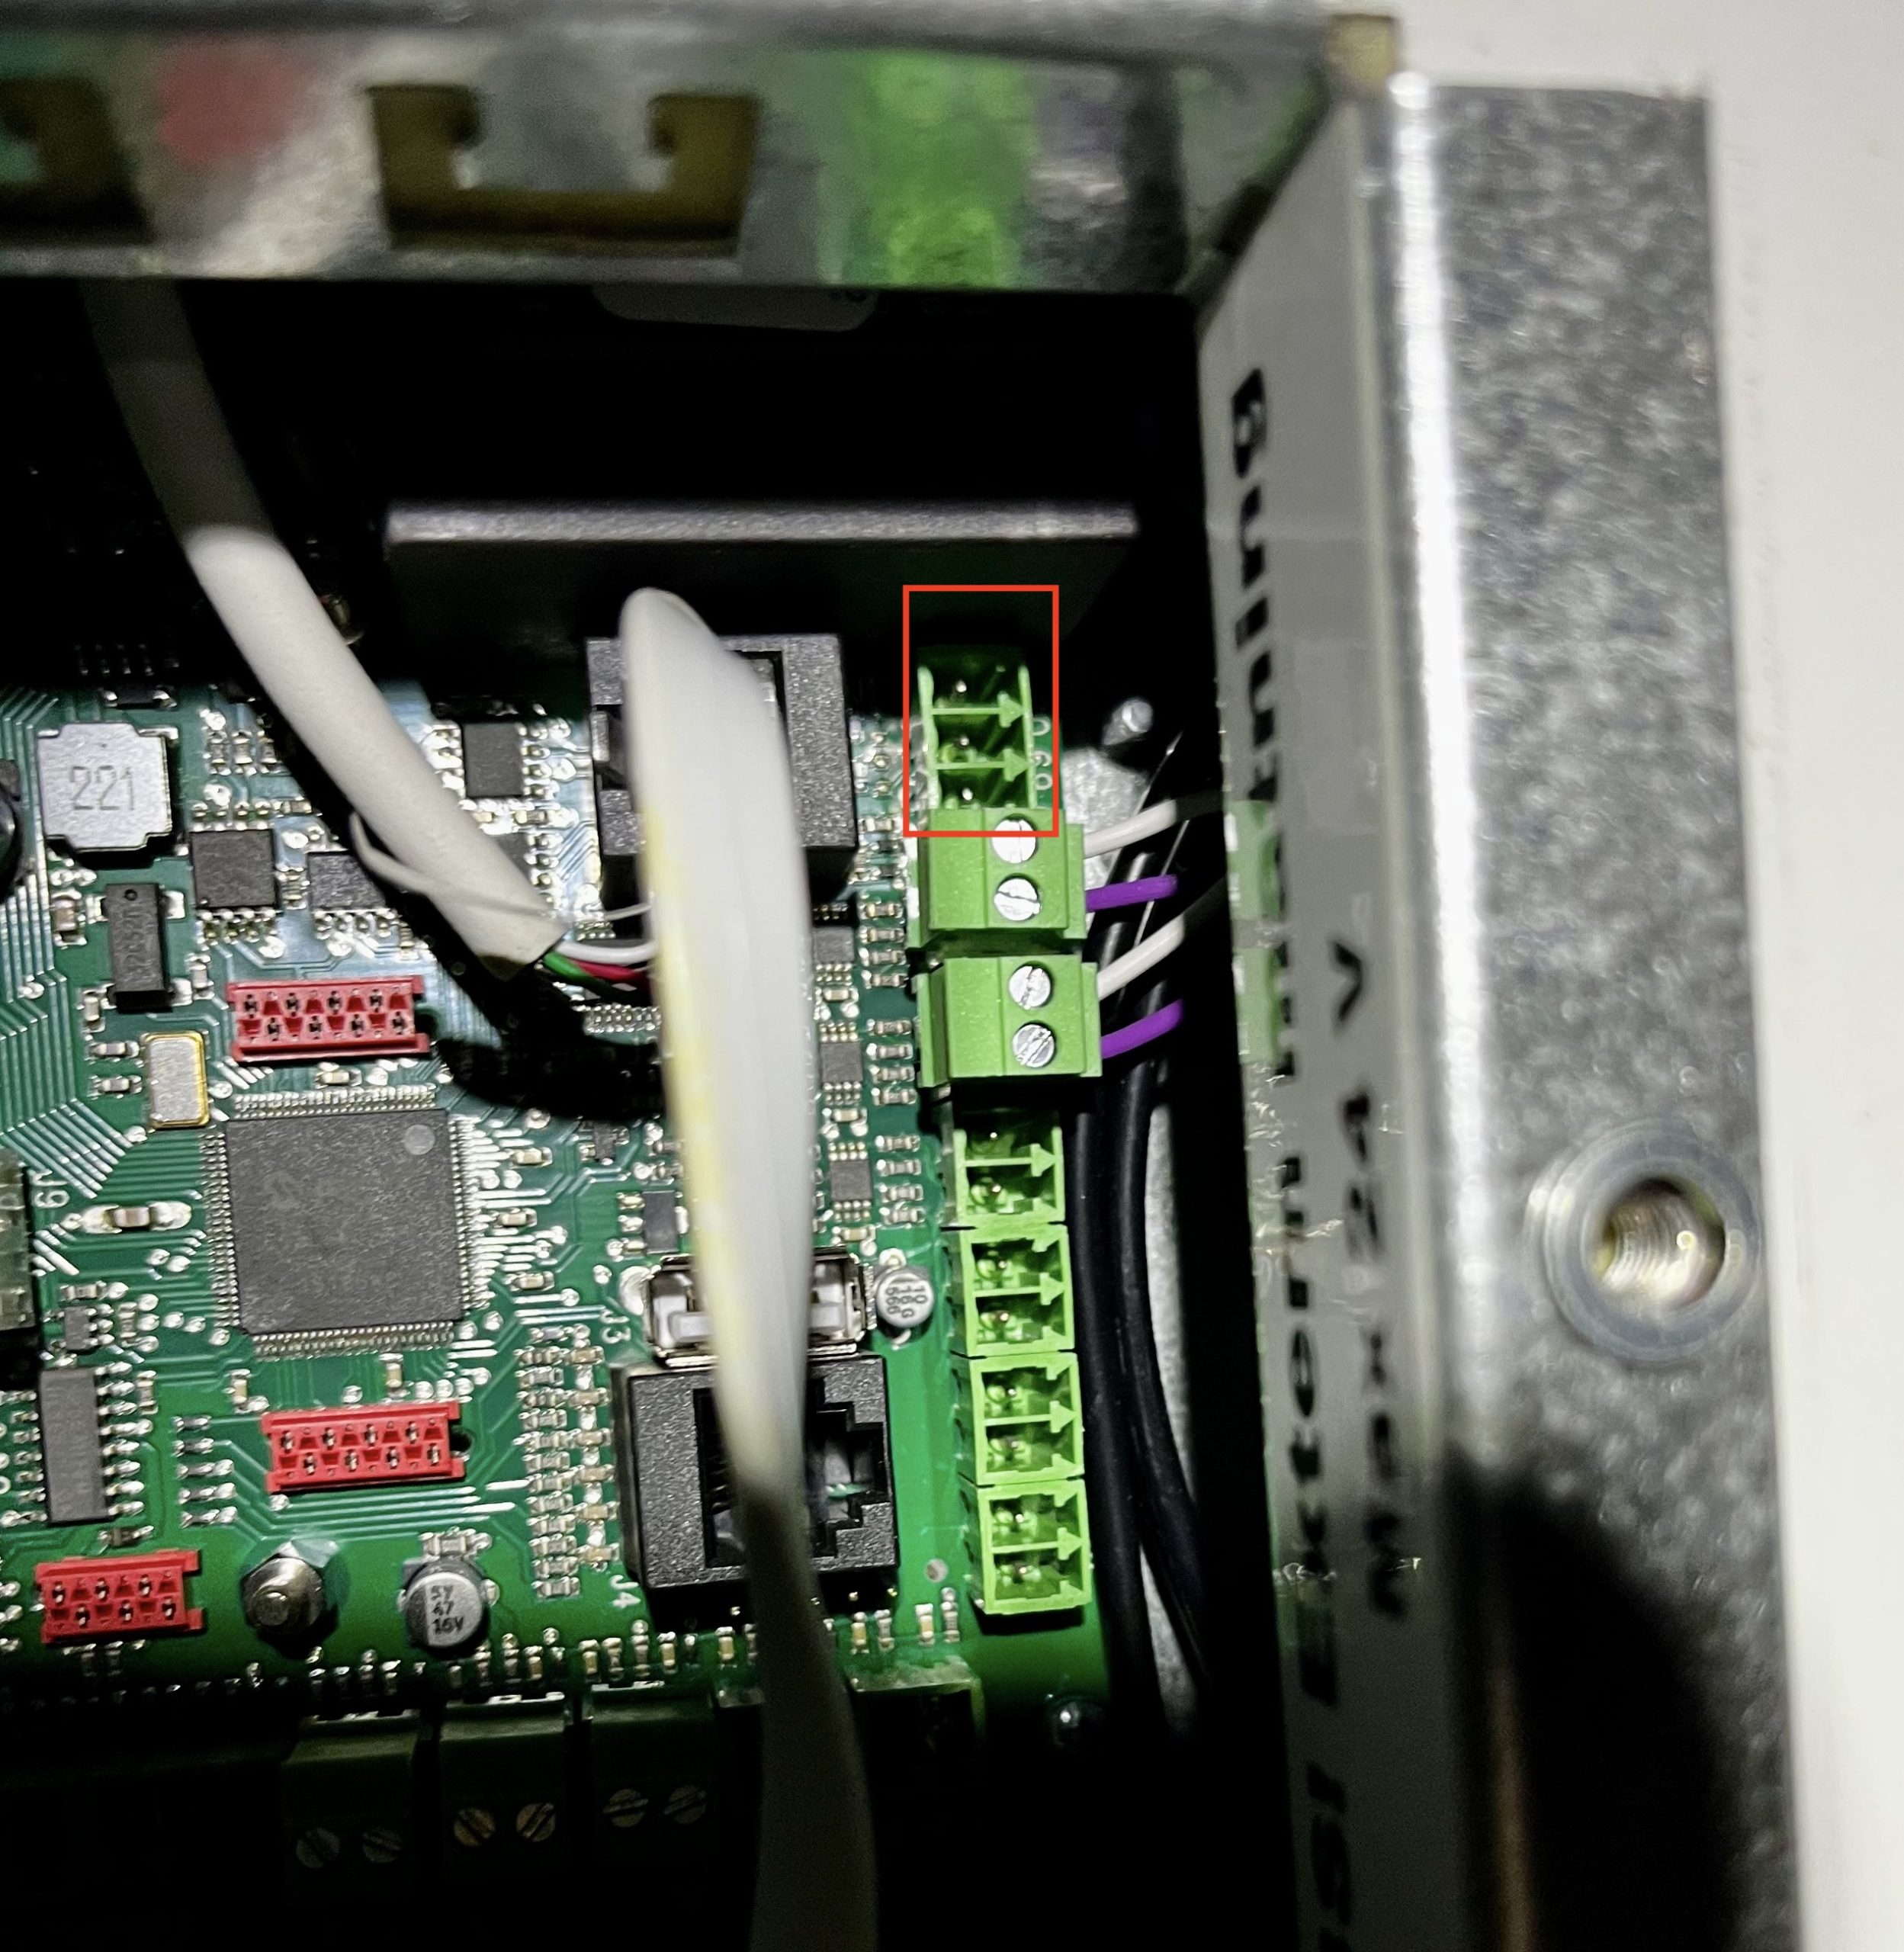
Modbus port

Ingång för modbus

Modbus over tcp/ip

För att på ett enkelt sätt kommunicera med en modbus-enhet från Home Assistant började jag leta efter en lämplig gateway. Efter ett tag hittade jag en gateway från WaveShare som verkade göra vad jag är ute efter. Enligt dokumentationen kan den göra ganska mycket, men själv översätter jag bara modbus tcp/ip till modbus över rs485.

Du hittar produkten här https://www.waveshare.com/product/rs485-to-eth-b.htm men det finns en rad olika webbutiker som säljer den.
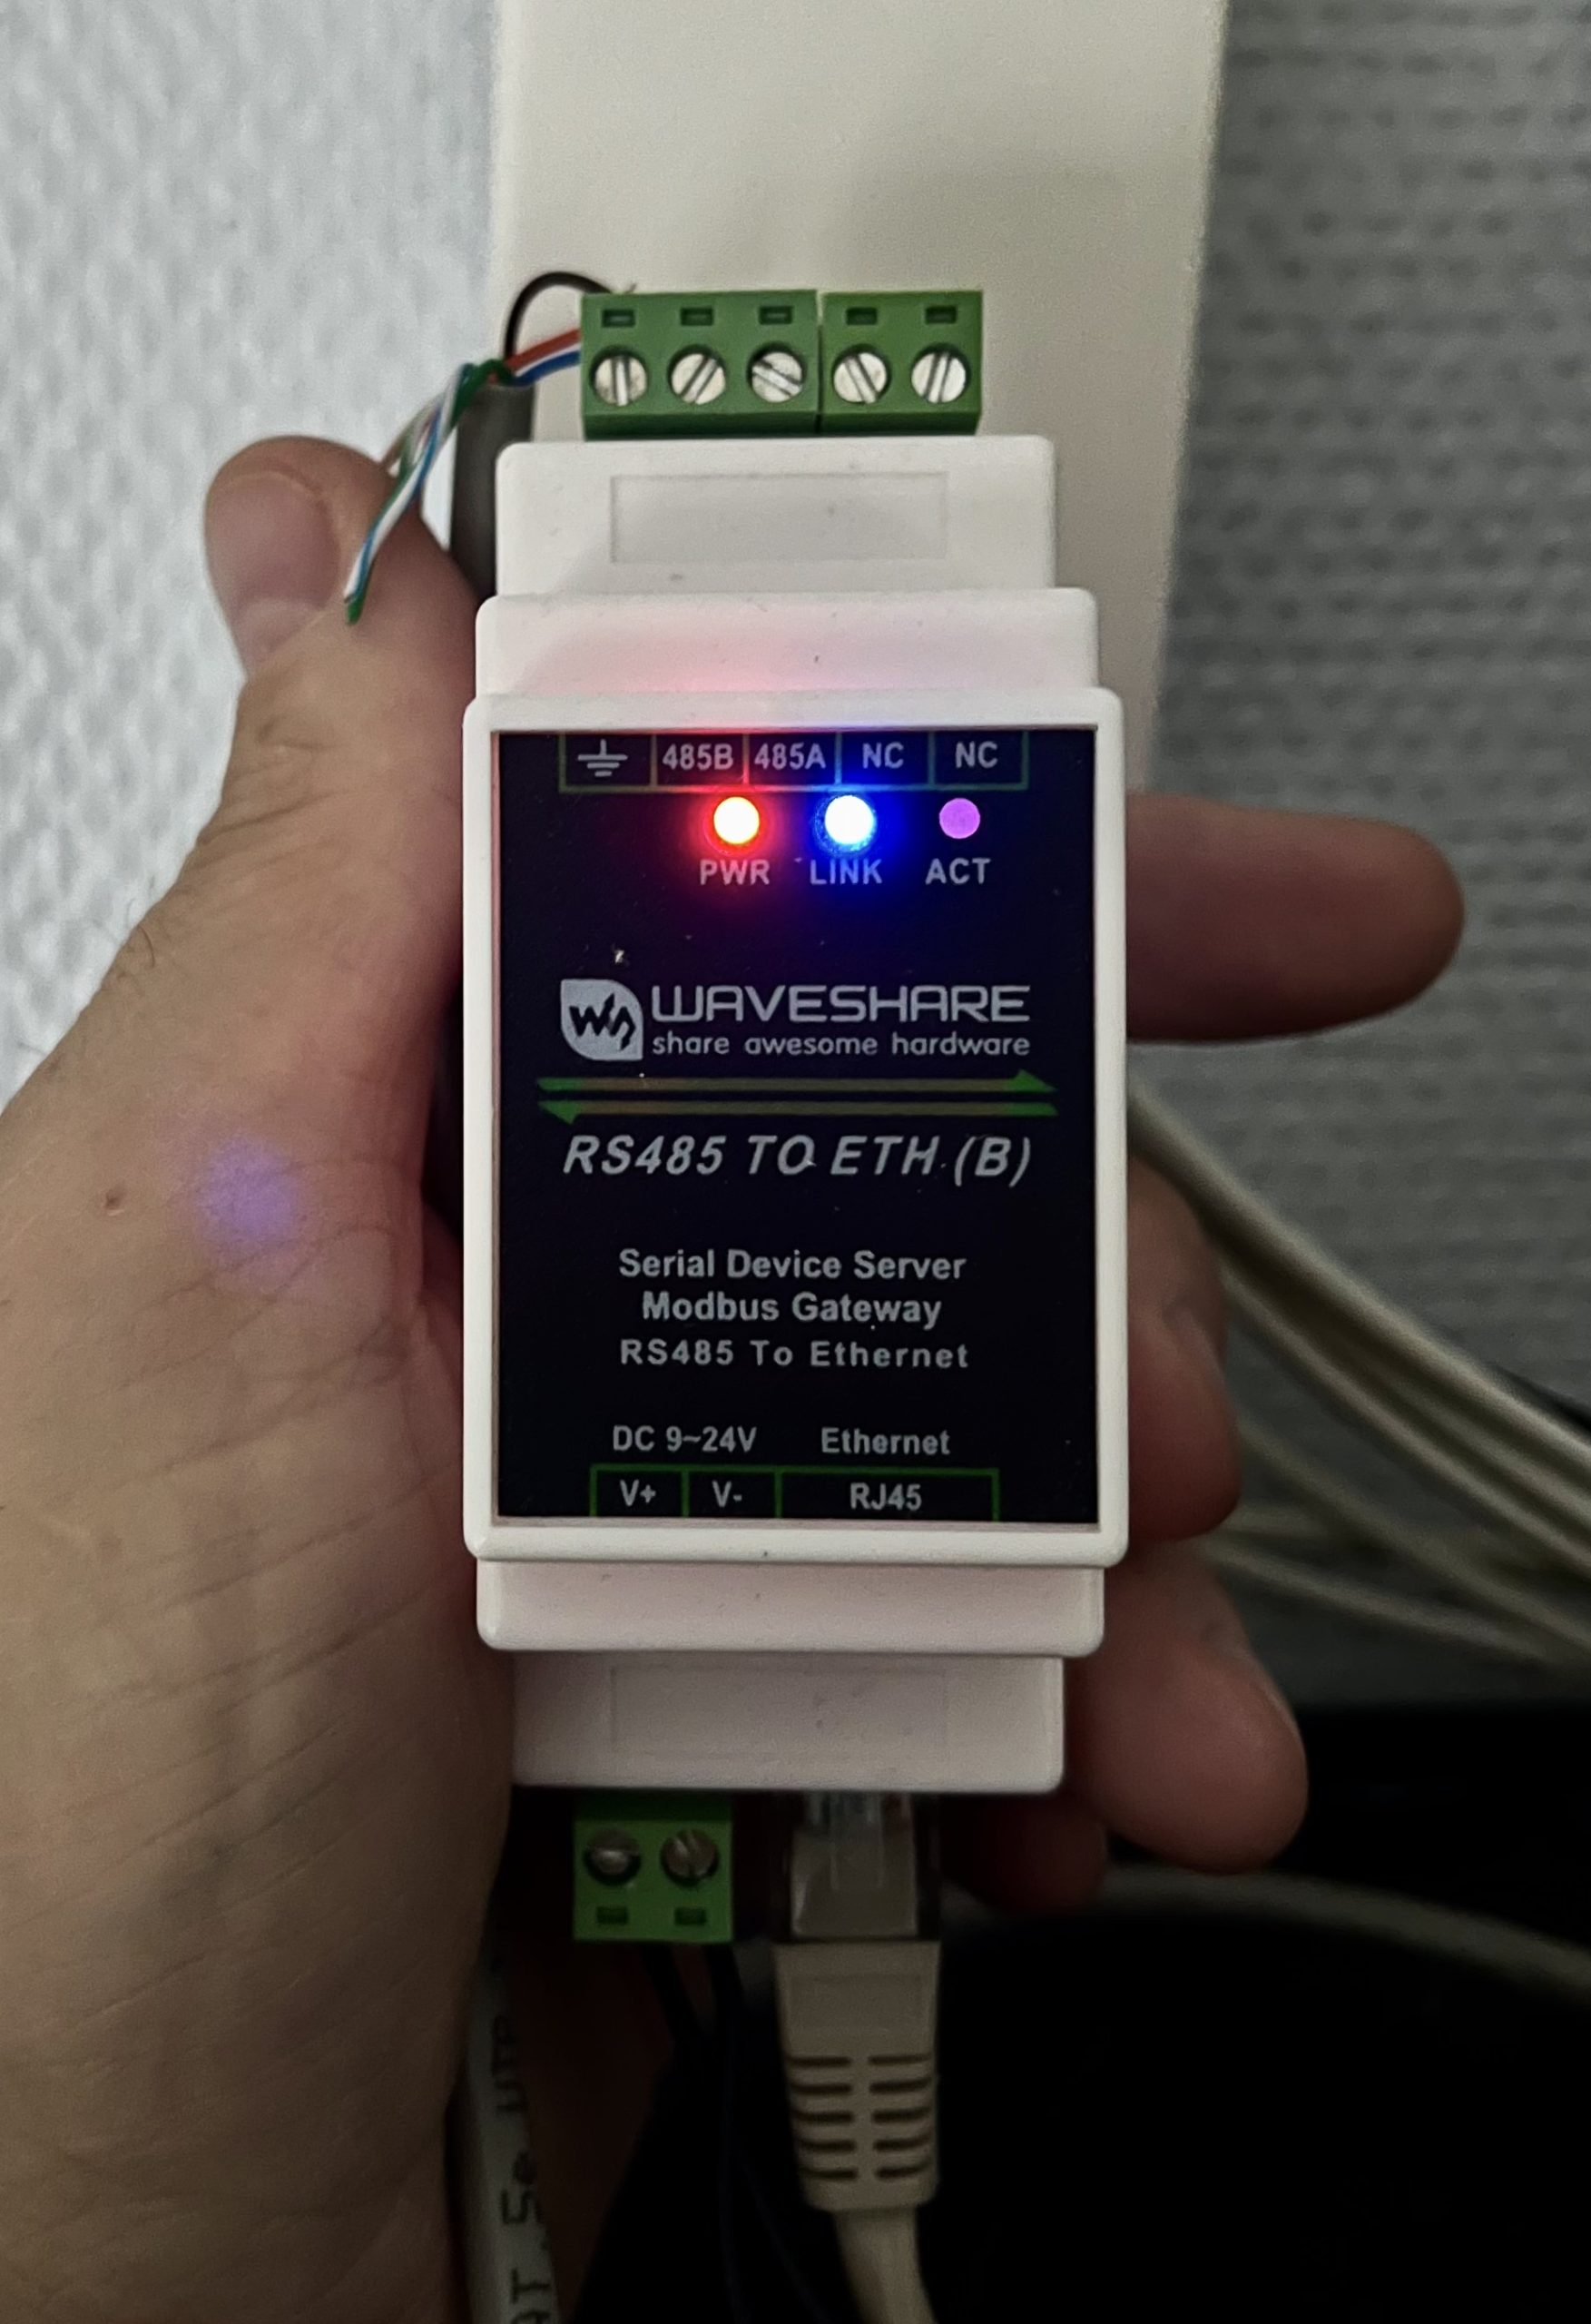
Modbus gateway

Modbus Gateway

När du ansluter gatewayen till nätverket kommer den att fråga efter en IP med DHCP, därefter kan du ansluta till enheten med en vanlig webläsare och konfigurera enheten.

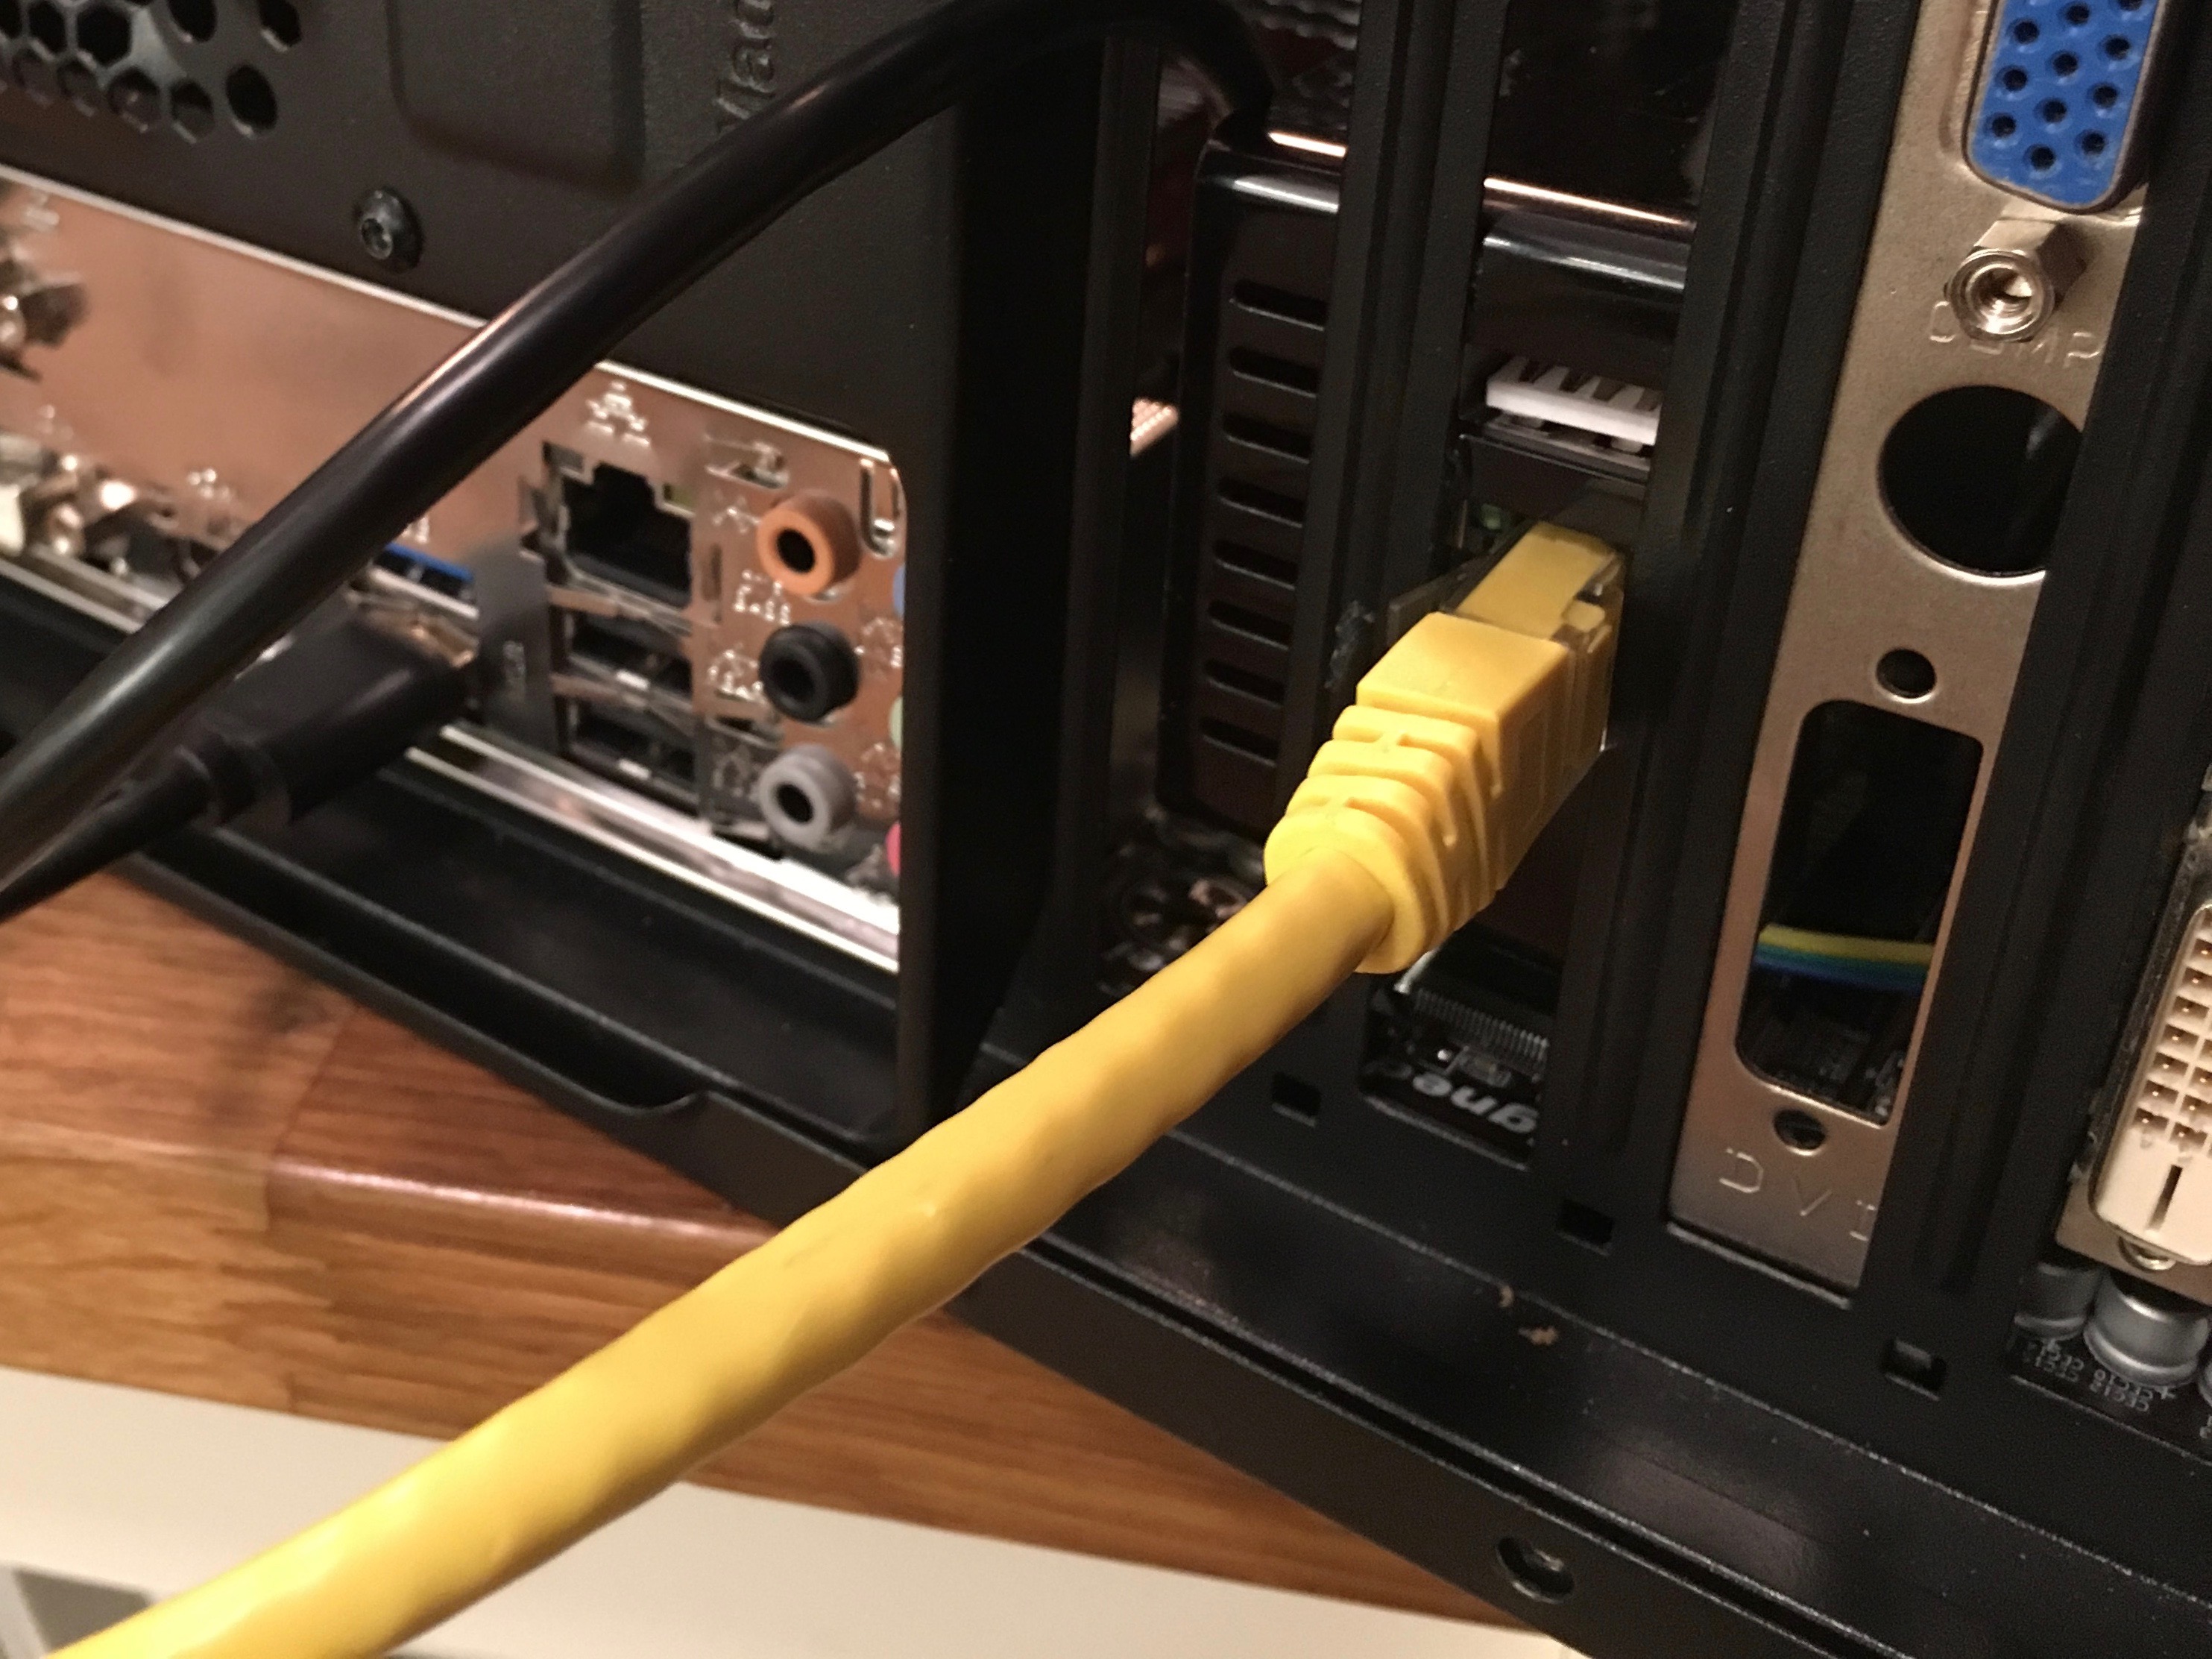
När detta är gjort är det sista arbetet att dra kablage mellan aggregatet och modbus gateway. Du kan förslagsvis använda vanligt CAT-kablage. Dessa kopplas sedan dels till gatewayen och dels till skruvplinten som i sin tur ansluts till aggregatet. Var noga med att ansluta rätt kabel till rätt port, A till A, B till B och jord till jord.

Jag ägnade en hel del tid med att felsöka och labba innan jag hittade en inkoppling och konfiguration som verkade fungera, men såhär ser min konfiguration ut idag:

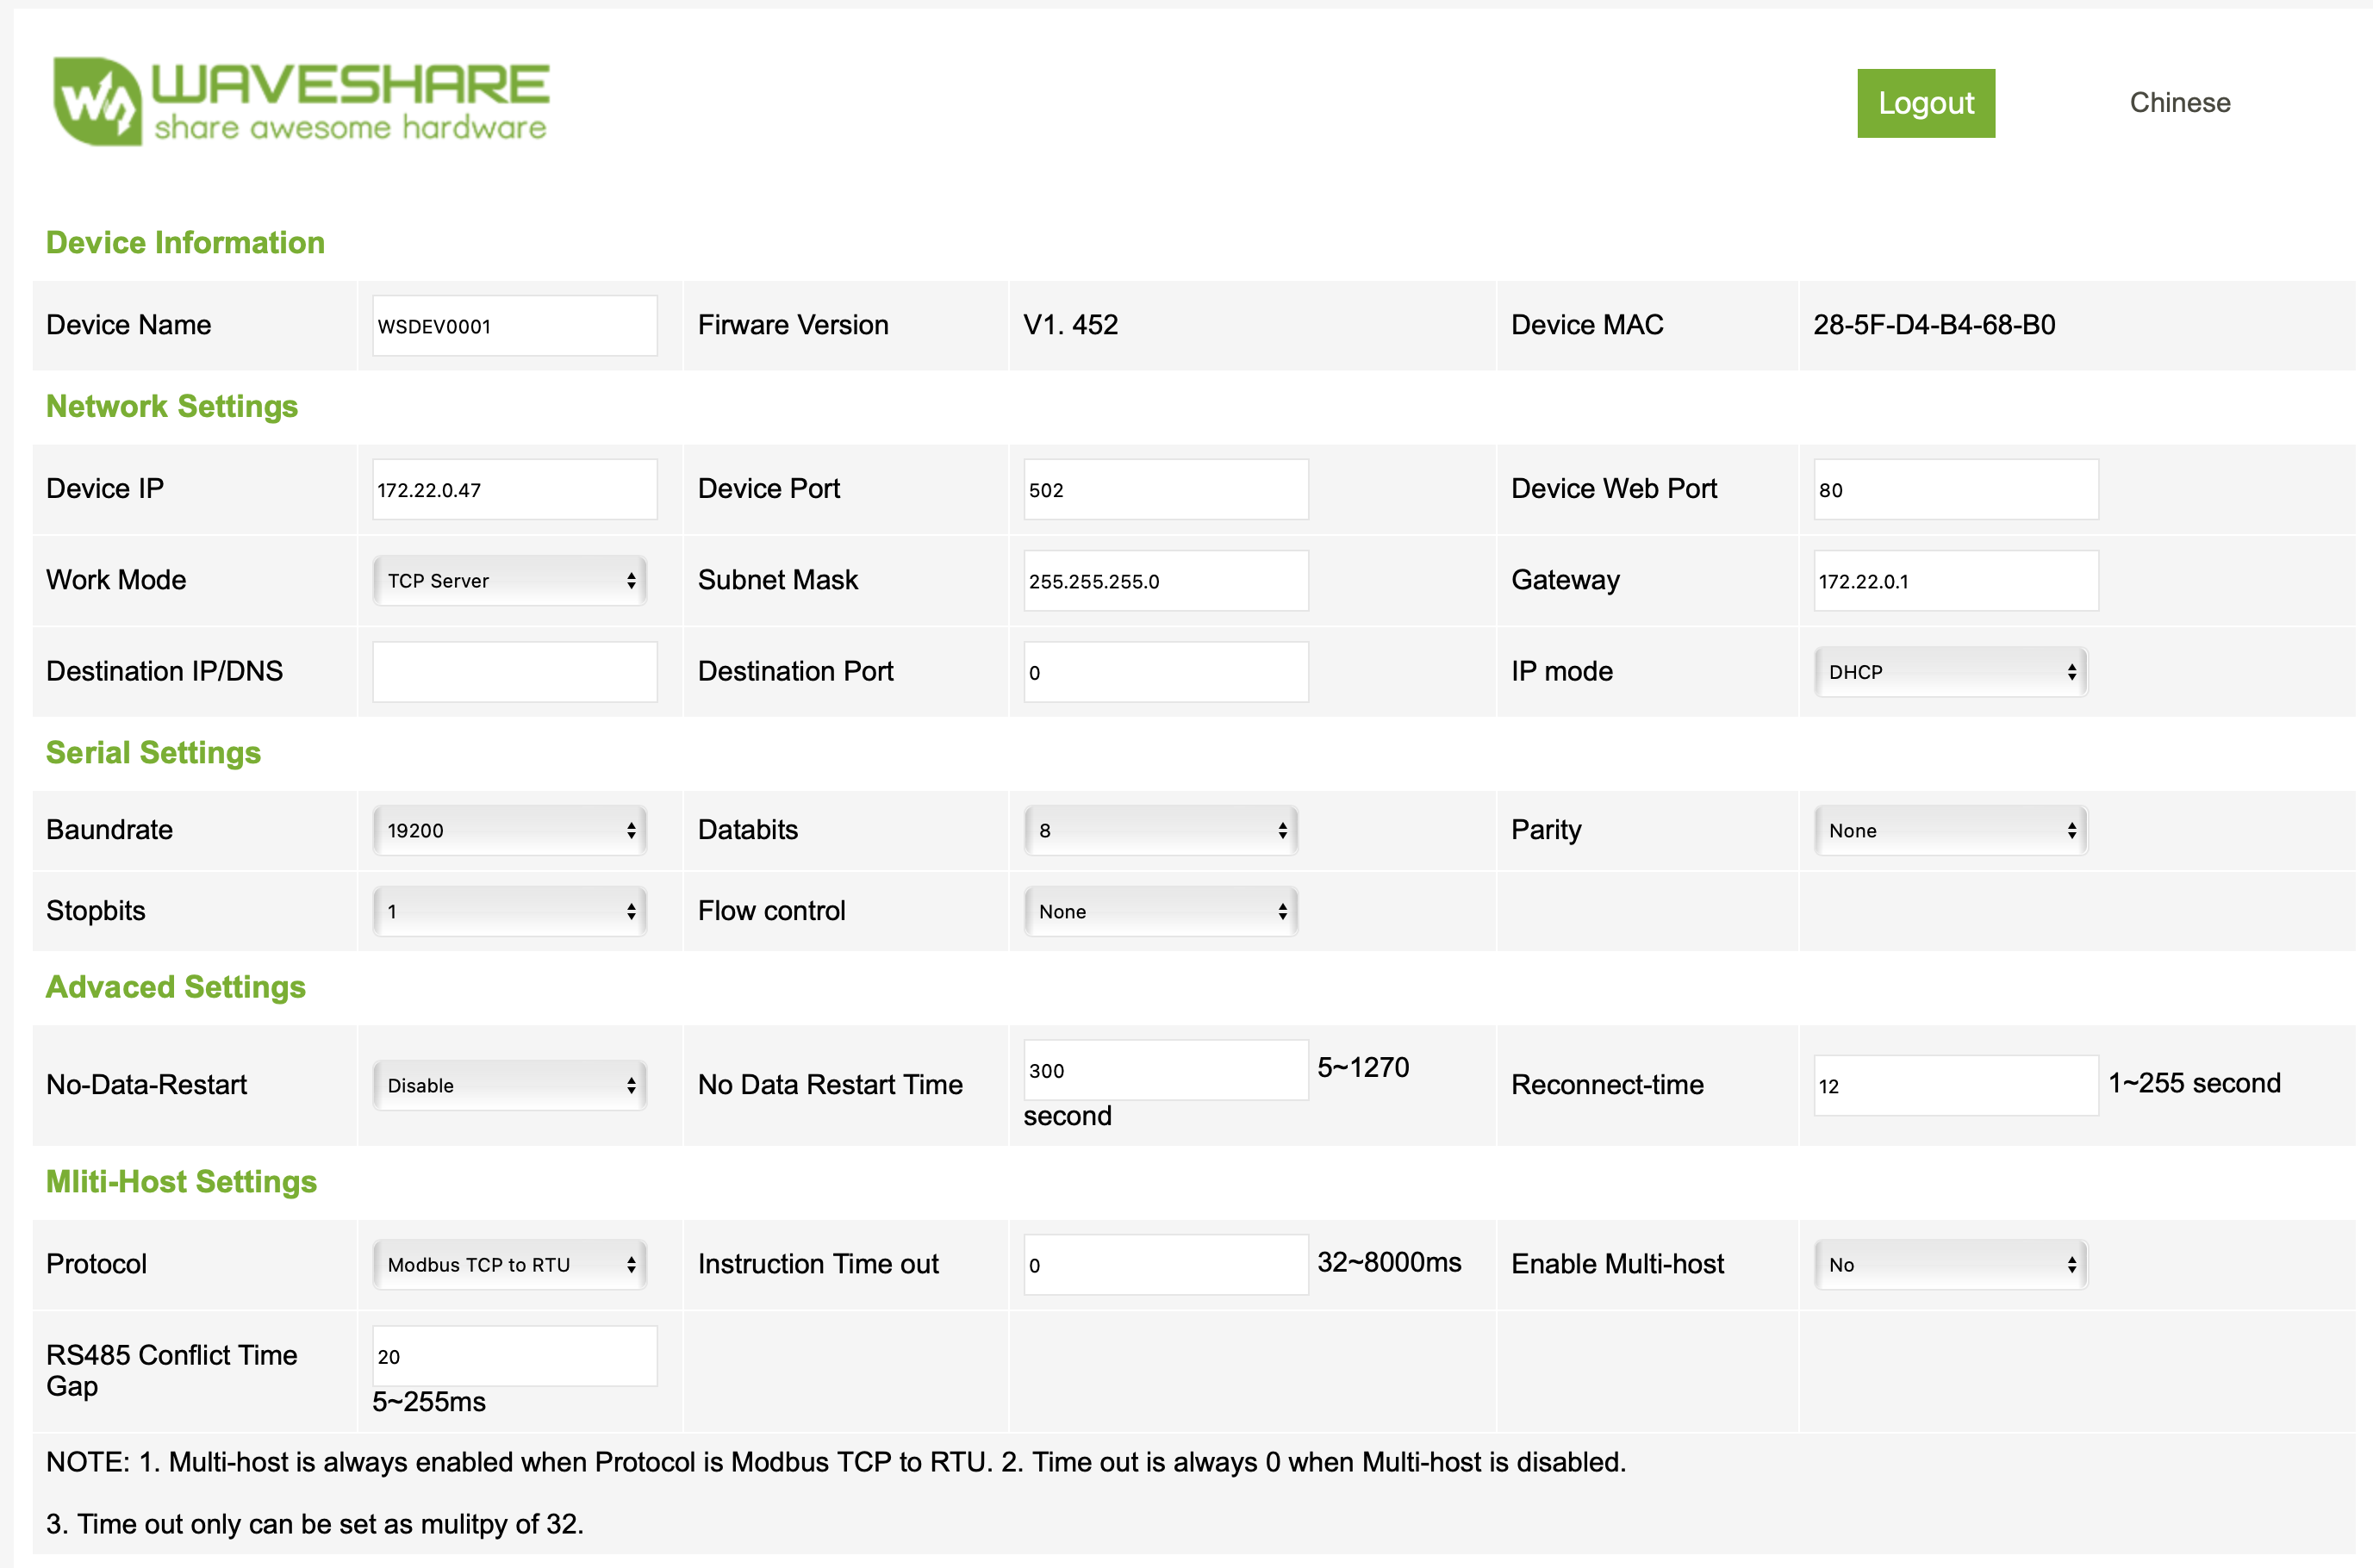
Konfigurationsinterface för waveshare modbus gateway

Om du har problem att få igång modbus-trafiken så underlättar det att ha en modbus-porgramvara på datorn där du kan testa olika register, slav-adresser osv. Om du har problem att få igång det kan du behöva switcha A och B på gateway-sidan enligt dokumentationen ovan.

Dokumentation om vilka register osv som gäller hittar du på FläktGroups webbplats: https://www.flaktgroup.com/api/v1/Documents/699dada6-4648-44ca-aca3-6813be8ec08b/

Home Assistant

När du har en fungerade modbus-anslutning återstår bara att konfigurera upp “thermostater” sensorer och binära sensorer i home assistant. För detta utgick jag från FläktGroups modbus dokumentation som du hittar på deras webbplats: https://www.flaktgroup.com/api/v1/Documents/699dada6-4648-44ca-aca3-6813be8ec08b/

Här är min kompletta konfiguration vilket innefattar grundinställning för modbus, en klimat/thermostat, binära sensorer, samt sensorer. Notera att register-adresserna saknar de inledande 40, jag vet inte varför, men använder jag hela adressen fungerar det inte för mig.

modbus:
  - name: ftx
    type: tcp
    host: 172.22.0.47
    port: 502
    climates:
      - name: "FTX Ventilation"
        address: 25
        input_type: holding
        slave: 2
        count: 1
        min_temp: 7
        target_temp_register: 49
        scale: 0.1

    binary_sensors:
      - name: Brandlarm (FTX)
        address: 94
        input_type: coil
        slave: 2
      - name: Fel tilluftssensor (FTX)
        address: 95
        input_type: coil
        slave: 2
      - name: Fel uteluftsensor (FTX)
        address: 96
        input_type: coil
        slave: 2
      - name: Fel frånluftssensor (FTX)
        address: 97
        input_type: coil
        slave: 2
      - name: Fel värmeväxlare (FTX)
        address: 111
        input_type: coil
        slave: 2
    sensors:
      - name: flakthastighet (FTX)
        address: 202
        input_type: holding
        slave: 2
      - name: Temperatur tilluft (FTX)
        unit_of_measurement: '°C'
        device_class: temperature
        slave: 2
        address: 25
        scale: 0.1
        precision: 1
      - name: Temperatur uteluft (FTX)
        unit_of_measurement: '°C'
        device_class: temperature
        slave: 2
        address: 26
        scale: 0.1
        precision: 1
      - name: Temperatur frånluft(FTX)
        unit_of_measurement: '°C'
        device_class: temperature
        slave: 2
        address: 27
        scale: 0.1
        precision: 1
      - name: Luftfuktighet tilluft (FTX)
        unit_of_measurement: '%'
        device_class: humidity
        slave: 2
        address: 35
      - name: Luftfuktighet frånluft(FTX)
        unit_of_measurement: '%'
        device_class: humidity
        slave: 2
        address: 36
      - name: Fläkthastighet tilluft(FTX)
        unit_of_measurement: '%'
        slave: 2
        address: 41
      - name: Fläkthastigt frånluft (FTX)
        unit_of_measurement: '%'
        slave: 2
        address: 42
      - name: förrvärme tilluft(FTX)
        unit_of_measurement: '%'
        slave: 2
        address: 43
      - name: Eftervärme tilluft(FTX)
        unit_of_measurement: '%'
        slave: 2
        address: 44
      - name: Värmeåtervinning(FTX)
        unit_of_measurement: '%'
        slave: 2
        address: 46
      - name: Börvärd ventilion (FTX)
        unit_of_measurement: '°C'
        device_class: temperature
        slave: 2
        address: 49
        scale: 0.1

När du lagt till ovan i konfigurationen och startat om Home Assistant bör du verifiera att allt fungerar via Developer Tools. Om du ser rimliga värden för temperaturer osv, så kommunicerar troligen Home Assistant korrekt med aggregatet och då är det dags att skapa en dashboard för styrningen. Nedan finns ett exmpel på hur en sådan kan se ut.

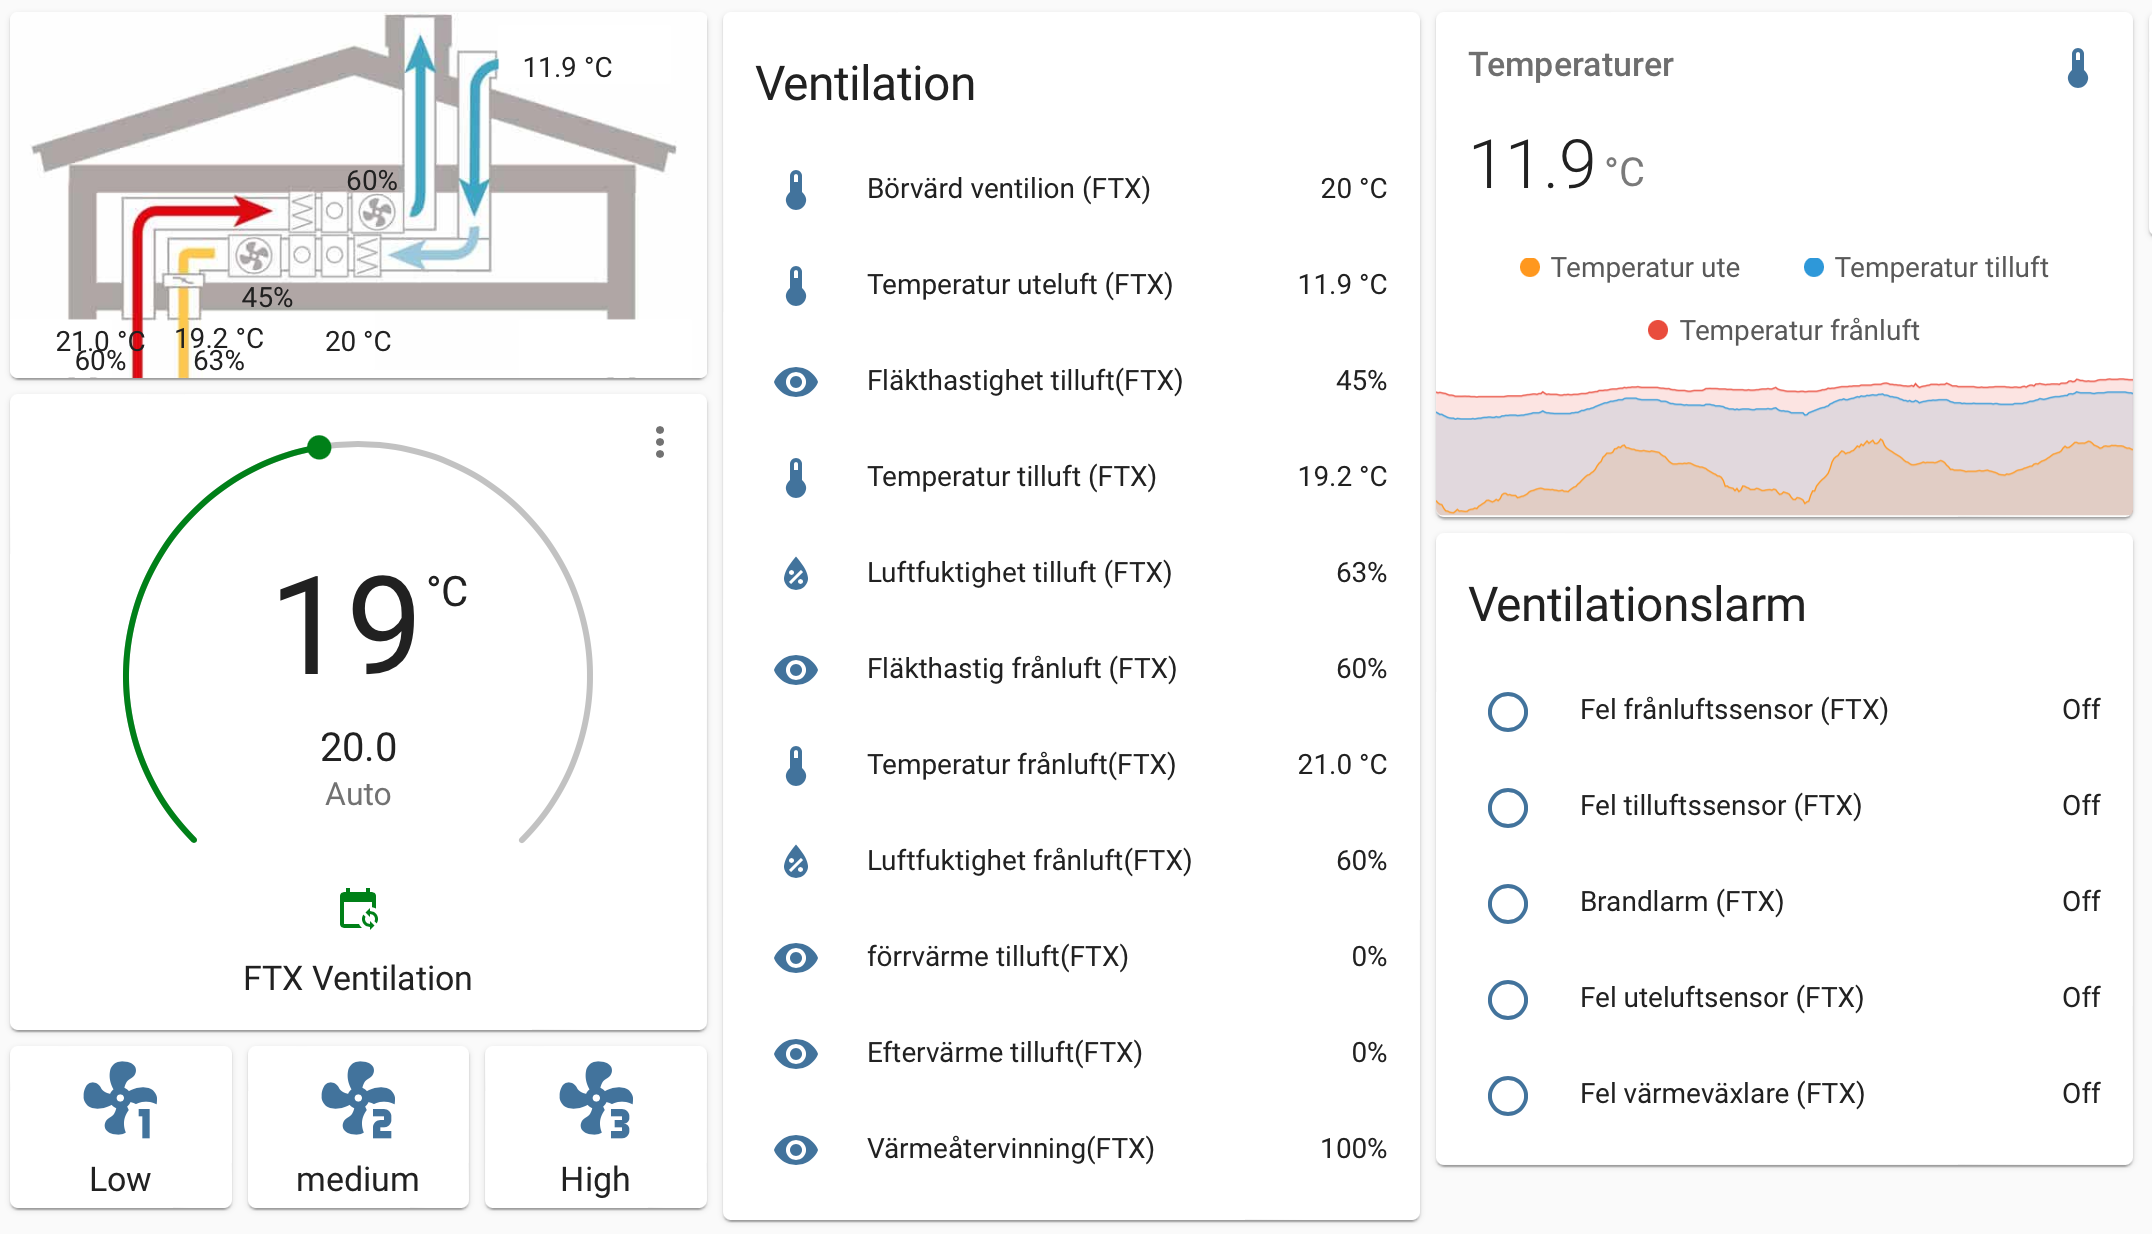
Enkel dashboard i Home Assistant

För att styra fläkthastigheten behöver du sätta ett register till 0,1,2 beroende på om du vill ha låg, medium eller högt flöde. Detta görs via en service “Modbus: Write register”. Registret som ska sättas är 202 och slav-adressen är i mitt fall 2 vilket troligen är standardinställningen.

Verifiera att det fungerar genom att titta på kontrollenheten samtidigt som du skriver till registret, om motsvarande förändring syns på skärmen har du lyckats.

Running ELK-stack on FreeBSD

This article describes how to install  and run ELK-stack (Elasticsearch, Logstash and Kibana) on FreeBSD.

Background

The ELK-stack (now called Elastc Stack) is a powerful software stack consisting of Elasticsearch, Logstash and Kibana that can be used to store and search data (Elasticsearch), harvest log files and other metrics (Logstash) and visualise the data (Kibana).  The stack is optimized for running on Linux but ports to FreeBSD have existed for a long time. This article describes the basic steps to get ELK-stack running on FreeBSD.

Install and configure Elasticsearch

Elasticsearch is a distributed search and analytics engine that stores all actual data in the ELK-stack. The most basic configuration is very simple, we just need to install the package: pkg install elasticsearch7

and configure what ports to listen to and where to store the data in

cluster.name: generic
node.name: node1
path.data: /usr/elasticsearch
path.logs: /var/log/elasticsearch
http.port: 9200

Install and configure Logstash

Logstash will be doing the “heavy lifting” in our setup. Logstash is used to parse all our logs and feed them into elasticsearch i a searchable format. You can think of every record in elasticsearch as a set of key-values and Logstash is used to extract the key/values from plain text logs (this is of course much easier if your application already logs in json format for example) or other input data. The basic configuation is simple, just install logstash: pkg install logstash7

and configure where to find your pipeline configuration

path.config: /usr/local/etc/logstash/conf.d/
Basic pipeline

This is an example of a very basic pipeline that reads a log file and outputs the data to Elasticsearch

input {
    file {
        path => "/var/log/messages"
    }
}

output {
    elasticsearch { 
        hosts => [ "localhost:9200" ]
    }
}
Minimal actual pipeline

This example will parse actual logs from the pkg(8) tool in FreeBSD. There is plenty of resources online on how to parse other types of logs.

input {
    file {
        path => "/var/log/messages"
    }
}
filter {
    # Parse standard syslog format. Match timestamp and remove it from message
    grok {
        match => { "message" => "%{SYSLOGBASE} %{GREEDYDATA:message}"}
        overwrite => "message"
    }
    # Parse standard syslog date
    date {
        match => [ "timestamp","MMM  d HH:mm:ss", "MMM dd HH:mm:ss", "ISO8601" ]
        remove_field => [ "timestamp" ]
    }
    
    # If basic syslog parser found the logging program to be "pkg" then parse out package and action
    # Mar 16 20:58:17 torus pkg[37129]: kibana7-7.6.1 installed
    if [program] == "pkg" {
        grok {
            match => [
                "message", "%{NOTSPACE:pkg_package} %{WORD:pkg_action}"
            ]
         }
    }
}
output {
    elasticsearch {
        hosts => [ "localhost:9200" ]
    }
}

Install and configure Kibana

Kibana is the visualisation tool bundled in the ELK-stack. With Kibana you can build visualisations and dashboards for your data making it easier to search and understand. Install kibana: pkg install kibana7

and configure it

server.host: "localhost"
server.port: 5601

Running your ELK-stack

When all components are configured you can start your them by:

# sysrc elasticsearch_enable=YES
# sysrc logstash_enable=YES
# sysrc kibana_enable=YES
# service elasticsearch start
# service logstash start
# service kibana start

Now you should have a logstash instance running that reads /var/log/messages and send each log row as a record to elasticsearch for indexing. You can then view the data using Kibana by visiting http://127.0.0.1:5601

Please note that you will need to configure index patterns in kibana before you can actually search and visualise data in kibana. This is outside the scope of this article but there is plenty of resources online on this.

Quick note on beats

When you need to ship data/logs from one machine to another the state of the art way to do this is to use the filebeat component in beats, which is now included in the Elastic stack.

Beats can also be used to collect other types of metrics like network performance data, netflow and it can also parse many different log file types out of the box. This makes the tool very powerful for collection logs and/or metrics and ship them to elasticsearch.

Inspecting NetFlow data with nfdump

This article describes how to inspect NetFlow which has been collected using nfcapd(1) from the nfdump toolkit with nfdump(1)

Background

In the article Collect and save NetFlow data with FreeBSD I describe what NetFlow is and how to collect and store NetFlow using FreeBSD. But without an efficient way to inspect the data it is practically useless.

Using nfdump

nfdump uses a filtering syntax that is similar to bpf-syntax (the one tcpdump uses). This means that everyone familiar with tcpdump could get started rather quickly. For example:

$ nfdump -R netflow/ -o tstart -o extended 'host 172.18.37.34 and port 53'

Often you want to sort on a specific metric, for example “which hosts have the most traffic on port 53”, this can be done using the statistics option -s

$ nfdump -R netflow/ -s ip/bytes 'port 53'

Another really useful feature is aggregation. This can be used to aggregate all flow records over a specific set of parameters. The below example uses option -A to aggregate all flows where srcip and dstip are the same and then filters out a specific host of interest. In other words “Who has been talking to host x”

$ nfdump -R netflow/ -A srcip,dstip -n 20 'host x'

If you want to see flows for a specific timeframe you can use the -t option like this

$ nfdump -R netflow/ -s ip/bytes -n 20 -t 2019/01/21-2019/01/22

You can also change the output format to suit your needs. The formatting syntax are a little bit unintuitive (at least I haven’t seen it before) so you may have to reference the manual

$ nfdump -R /data/netflow/ -o tstart -o 'fmt:%ts %pr %sap %dap'

Flow records by them self have no sense of sessions and are unidirectional. If you want to see data for bidirectional flows you can tell nfdump to aggregate on bidirectional flows using -b or -B

$ nfdump -R netflow/ -A srcip,dstip -n 20 -B 'host x'

But please note that it is a guess.

This was a short introduction on how to inspect netflow data with nfdump. Please leave a comment if you have any questions or suggestions.

Collect and save NetFlow data with FreeBSD

This article describes how to export and collect and save NetFlow data with FreeBSD. In this article I will use the term NetFlow as a general description of NetFlow and similar protocols like sFlow and IPFIX.

Background

NetFlow was introduced in Cisco routers 1996 and is a convenient and cheap way of storing traffic metadata centrally. In its most basic form it stores information about: src ip, src port, dst ip, dst port, number of bytes and packets. Exactly what information that is captured depends on the specific version and implementation of Netflow.

Often NetFlow is collected on routers and switches in your environment. They are then exported to a central point for later use. These devices are called exporters. Exactly where you perform this operation depends on where you need visibility and on device capability. The flow records are then sent to a flow collector for later use.

Flow records can be used for a number of things such as network monitoring, billing, troubleshooting and digital forensics.

Flow exporter with FreeBSD

If a FreeBSD machine performs a network function such as a filtering bridge or router in your network you may want to also use it as a flow exporter in order to gain network visibility. The good news is that there is already support for this in the kernel together with the netgraph framework. I have honestly tried my best to understand what netgraph really is. My best description so far is that it is a framework for connecting different network functions in a arbitrary way (a graph).

To allow for generation of netflow records you need to load a few kernel modules: netgraph.ko, ng_netflow.ko, ng_ether.ko, ng_ksocket.ko.

# kldload netgraph ng_netflow ng_ether ng_ksocket

This is a basic example from the ng_netflow(4) manual. It creates a netflow node and routes all traffic to interface igb0 through it and then routes it back to igb0. The export side of the netflow node is connected to a ksocket node which is configured to send the netflow data to 10.0.0.1 on port 4444.

# /usr/sbin/ngctl -f- <<EOF
    mkpeer igb0: netflow lower iface0
    name igb0:lower netflow
    connect igb0: netflow: upper out0
    mkpeer netflow: ksocket export9 inet/dgram/udp
    name netflow:export9 exporter
    msg netflow: setconfig {iface=0 conf=7}
    msg netflow:export9 connect inet/10.0.0.1:4444
EOF

I have made a few changes from whats in the manual. Set conf=7 for the netflow node which tells it to export flows for both incoming and outgoing packets, by default it only captures incoming packets. Also I have also used the export9 hook in order to export NetFlow V9 data.

To visualize this graph you can use the command “ngctl dot”. This is how my resulting graph looks like:

ngctl dot

Flow collection with FreeBSD

There is several softwares that can be used to collect flows on a FreeBSD machine. In the past I have used rwflowpack which is part of the “SiLK stack” from CERT NetSA. While it is very powerful it can be a little bit overkill for smaller networks. So these days I have moved over to nfcapd which is part of the nfdump toolkit. You can install it from the package collection:

# pkg install nfdump

Running nfcapd is very straight forward. This example accepts flow records on port 4444 and stores them in /usr/netflow/. -S -w and -t has to do with the rotation of saved capture-files.

# /usr/local/bin/nfcapd -S 1 -w -t 3600 -D -l /usr/netflow/ -p 4444

Inspect the flow data

Reading flow data can be done using the tool nfdump. You can find my article about it here: Inspecting NetFlow data with nfdump

Make these changes permanet

How to make these changes permanent or applied at boot is beyond the scope of this article but there is several good descriptions on how to write rc-scripts for FreeBSD out there, for example the official docs https://www.freebsd.org/doc/en/articles/rc-scripting/article.html

How to configure 802.1X client and server in FreeBSD

This article describes the steps required to configure 802.1X client and server using EAP-TLS both client and server side in FreeBSD.

Background

I recently bought a new switch of ebay capable of 802.1X PNAC (Port based Network Access Control). I wanted to have this set up for a long time, but it wasn’t unil now I had a switch thats actually supported it. This article describes how I got it up and running.

Certificates

Since I already have EAP-TLS set up for my wifi (authentication using X.509 client certificates) I will also use EAP-TLS for wired access. So I configured a private CA in order to issue both server certificates for the radius server and also client certificates for all clients that will use my network.  I have a more general post about how set up the CA here.

Radius server (Authentication server)

You will need to configure a Radius server to handle the authentication requests. I already have EAP-TLS configured using hostpad and its internal radius server for my wifi. But that server is very limited, so I decided to give FreeRADIUS a go. This also means that my wifi clients will be authenticated using the FreeRADIUS server from now on.

I understand that FreeRADIUS is very flexible and “easy” to customize, but I really think that the configuration is very hard do grasp. It would be virtually impossible to configure it without some guide to follow. The two big problems are that the configuration is split up into MANY files and that all the documentation is inside the config files, which makes them really hard to read. Luckily I found this guide online that did exactly what I wanted. So please have a look at that guide under “Configuration” to see how I configured FreeRADIUS. Its basically just a few minor changes in four files.

The switch (Authenticator)

This article will not cover the switch configuration needed for this setup. The configuration you will have to do is very depended on what brand of switch you have and what software it is running.  I have a Juniper EX2200-C and there is good online documentation on how to set up 802.1X.

The Supplicant (802.1X client)

In 802.1X the client is called the supplicant. To authenticate against the radius server you will basically need a small supplicant software installed on the client that will handle the authentication. This is done using EAPOL-packages that are sent out on the network and then handled by the switch (The Authenticator). The switch then talks to the raidus server (The Authentication server) to verify the client.

In Linux and FreeBSD the most commonly used supplicant software is called wpa_supplicant. Most of you who know of wpa_supplicant have used it for wifi authentication in differents forms. It can handle alot of different security types like WPA2 Enterprise, WPA2 or even WEP. But it can also work with wired network authentication. The configuration is actually very straight forward and similar to the wifi configs.

network={
    key_mgmt=IEEE8021X
    eap=TLS
    identity="identity"
    ca_cert="/etc/ssl/chain.pem"
    client_cert="/etc/ssl/client.cert.pem"
    private_key="/etc/ssl/client.key"
    private_key_passwd="passw0rd"
}

This is all you will need to have wpa_supplicant authenticate using client certificates over ethernet.

To have the wpa_supplicant automatically started when you FreeBSD machine boots you can just add the WPA keyword to your interface declaration in /etc/rc.conf like this:

ifconfig_ue0="DHCP WPA"

Smart Card/HSM backed OpenSSL CA

This article describes how to set up a Smart Card/HSM backed OpenSSL CA using a Smart Card HSM or any PKCS11 enabled device.

Background

Since some years back I use WPA2 Enterprise with EAP-TLS (Certificate authentication) for my wifi at home. Historically I have used certificates from a public CA for this purpose. This is not best practice since you don’t have control over the certificates that are issued.

Also, I recently bought a new switch capable of 802.1X authentication on all ports. For this purpose I want all my machines (even those without wifi) to have certificates. So I decided to go through the hassle of setting up my own private CA.

Setting up CA

For the basic setup of the CA I followed Jamies excellent guide on setting up a CA. So in this post you can assume that all the basic stuff like folders structure and basic commands are the same. I will only show you the differences needed to have the Root CA key stored on a PKCS11 device like a HSM, Smart Card HSM or a Yubikey. I will even try to follow his topic names so you can follow along.

Configure PKCS11 Engine

I will not discuss the operating system part of getting PKCS11 devices to work in this article. But basically you just need to install some packages, you can read about it here.

First of all we need to configure OpenSSL to talk to your PKCS11 device. This can be done from configuration or interactively on the command line.

From conf:

# At beginning of conf (before everything else)
openssl_conf            = openssl_def

# At end of conf (after everything else)
[openssl_def]
engines = engine_section

[engine_section]
pkcs11 = pkcs11_section

[pkcs11_section]
engine_id = pkcs11
dynamic_path = /usr/local/lib/engines/pkcs11.so
MODULE_PATH = /usr/local/lib/opensc-pkcs11.so
init = 0

From cli:

OpenSSL> engine -t dynamic -pre SO_PATH:/usr/local/lib/engines/pkcs11.so -pre ID:pkcs11 -pre LIST_ADD:1 -pre LOAD -pre MODULE_PATH:/usr/local/lib/opensc-
pkcs11.so

Create the root pair

First of all we need to have a RSA key pair on the PKCS11 device:

# pkcs11-tool --module /usr/local/lib/opensc-pkcs11.so -l --keypairgen --key-type rsa:2048 --label "SSL Root CA"
Using slot 0 with a present token (0x0)
Logging in to "HSM 2 (UserPIN)".
Please enter User PIN:
Key pair generated:
Private Key Object; RSA
  label:      SSL Root CA
  ID:         d15c3e9578a612a658bb14e0e147db4f2279cf19
  Usage:      decrypt, sign, unwrap
Public Key Object; RSA 2048 bits
  label:      SSL Root CA
  ID:         d15c3e9578a612a658bb14e0e147db4f2279cf19
  Usage:      encrypt, verify, wrap

Create the root certificate

I will assume that you have configured pkcs11 in openssl.cnf (otherwise you will have to first run the engine command in openssl interactively before any other command).

# openssl req -config openssl.cnf -new -x509 -days 7300 -sha256 -extensions v3_ca -engine pkcs11 -keyform engine -key 0:d15c3e9578a612a658bb14e0e147db4f2279cf19 -out certs/ca.cert.pem
engine "pkcs11" set.
Enter PKCS#11 token PIN for HSM 2 (UserPIN):
0x8018b6000 07:41:35.523 cannot lock memory, sensitive data may be paged to disk
You are about to be asked to enter information that will be incorporated
into your certificate request.
What you are about to enter is what is called a Distinguished Name or a DN.
There are quite a few fields but you can leave some blank
For some fields there will be a default value,
If you enter '.', the field will be left blank.
-----
Country Name (2 letter code) [SE]:
State or Province Name []:
Locality Name []:
Organization Name [PeanOrg]:
Organizational Unit Name []:PeanOrg Certificate Authority
Common Name []:PeanOrg Root CA
Email Address []:

Create the intermediate pair

For the intermediate key pair I followed jamies guide. I need frequent access to this CA so I have decided to have the intermediate pair on file instead of HSM.

Create the intermediate certificate

I changed one thing in jamies intermediate/openssl.cnf because I dont see the point of having province set in the CAs

stateOrProvinceName     = optional

To use the Root key stored on pkcs11 to sign the intermediate certificate use this command:

# openssl ca -config openssl.cnf -extensions v3_intermediate_ca -days 3650 -notext -md sha256 -engine pkcs11 -keyform engine -keyfile 0:d15c3e9578a612a658bb14e0e147db4f2279cf19 -in intermediate/csr/intermediate.csr.pem -out intermediate/certs/intermediate.cert.pem
Using configuration from openssl.cnf
engine "pkcs11" set.
Enter PKCS#11 token PIN for HSM 2 (UserPIN):
Check that the request matches the signature
Signature ok
Certificate Details:
        Serial Number: 4096 (0x1000)
        Validity
            Not Before: Apr  7 05:54:22 2018 GMT
            Not After : Apr  4 05:54:22 2028 GMT
        Subject:
            countryName               = SE
            organizationName          = PeanOrg
            organizationalUnitName    = PeanOrg Certificate Authority
            commonName                = PeanOrg Intermediate CA 1
        X509v3 extensions:
            X509v3 Subject Key Identifier:
                77:9C:07:23:FD:40:E9:5C:7E:30:73:8F:59:28:25:F5:06:43:B4:70
            X509v3 Authority Key Identifier:
                keyid:A4:F2:DE:15:8E:9E:A8:87:B0:95:D4:21:A2:BD:4C:41:02:93:E0:8D

            X509v3 Basic Constraints: critical
                CA:TRUE, pathlen:0
            X509v3 Key Usage: critical
                Digital Signature, Certificate Sign, CRL Sign
Certificate is to be certified until Apr  4 05:54:22 2028 GMT (3650 days)
Sign the certificate? [y/n]:y


1 out of 1 certificate requests certified, commit? [y/n]y
Write out database with 1 new entries
Data Base Updated

We now have all we need to sign certificates. Just follow Jamies guide Sign server and client certificates

References

It took me a few hours to get this going because of sort of a lack of documentation on how to use OpenSSL and PKCS11 together, during my efforts I found these resources helpful

Minimal scp only chroot in FreeBSD

Background

The other day I needed to receive a few files from a friend. And I wanted to provide an easy to use service to do so. Back in the days I did run a FTP service with anonymous login and write acces to a inbox folder (1777).  But these days I have a few more security concerns and wanted to provide a scp drop site, and exactly that. A “scp only chroot”.

Configuration

Giving chrooted ssh access is pretty straight forward in the sshd_config. But to actually get it to work you will have to fiddle around a bit. You will need to figure out exactly what files you will need inside the chroot for the service to function properly.

Create user

Just use your favourite way of creating users in your system.

sshd

The easy part is to configure your sshd_config to chroot the specific user, group or whatever you want to chroot. Since this is probably a one off for me I settled for a single user.

Match User scponly
  ChrootDirectory /home/%u
  X11Forwarding no
  AllowTcpForwarding no

This short configuration will chroot the user scponly to /home/scponly when it connects. You just need to restart sshd in order to these settings to take effect.

Setting up environment

The hardest part was to set up the environment since you will need to make all libs and so on available inside the chroot.

Since this was to be a one off solution I will not go through the hassle of loop/null mounts or stuff like that. I will simply copy the stuff thats actually needed into the chroot. To find out what libs you actually need you can use the tool ldd(1)

# ldd /usr/local/bin/scp 
/usr/local/bin/scp:
	libcrypto.so.8 => /lib/libcrypto.so.8 (0x800a00000)
	libz.so.6 => /lib/libz.so.6 (0x800e69000)
	libutil.so.9 => /lib/libutil.so.9 (0x801082000)
	libldns.so.2 => /usr/local/lib/libldns.so.2 (0x801296000)
	libcrypt.so.5 => /lib/libcrypt.so.5 (0x8014f3000)
	libc.so.7 => /lib/libc.so.7 (0x801712000)

So I just created a few directories in /home/scponly

# cd /home/scponly
# mkdir etc bin lib dev libexec

and then copied these libs to /home/scponly/lib/.

You will also need to have a shell that then can invoke scp. I copied /rescue/sh to /home/scponly/bin/ because it is statically linked and does not depend on any libraries. When all this was done I thought the whole thing was finished but I encountered a few problems.

Problems

The first one was scp complaining about missing ld-elf.so.1. So just like the other libs I just copied it in to /home/sftponly/libexec/.

Secondly scp started to complain about missing /dev/null. And my solution to this was to just create a empty file called null in /home/sftponly/dev/ and chmod to 666. Why it works with a regular file I dont know. If you have any idea please tell me in the comments.

The final problem I faced was an error when invoking scp that said “unknown user 1005”. I did some searches on the web and found several solutions that where Linux specific so no help there. But they involved putting a few more files and libs relevant to nss into the chroot.

What I finally found out was that its the /etc/master.passwd (think of shadow in linux) and its database that where missing. So I just did grep scponly /etc/master.passwd > /home/scponly/etc/master.passwd to copy only the record for scponly to the chroot.

sad:*:1005:1002::0:0:scp only user:/home/scponly:/bin/sh

Finally the actual databased needed to be created with this command

# pwd_mkdb -d /home/scponly/etc/ /home/scponly/etc/master.passwd

Thats it! Now I have a account thats basically all it can do is scp. Yes you can login and get a shell but since there is no other binaries than scp and sh you are pretty limited.

Cheap out of band management/ipmi replacement for home servers

This article describes how to build your own out of band system for your home server.

Background

If you have ever worked professionally with servers you have almost certainly come across some type of out of band management. HP iLO, Dell iDRAC, Huawei iBMC and so on. All more or less based on the IPMI standard. These are basically a small computer that lives independently from your server and give you control over the server even if its turned off for example. You can also virtually mount ISO images and get a console over a web interface and so on. In this way you can even do changes to BIOS settings and so on from a remote location. But probably the most used feature where I work is to simply send power commands to the server like “ipmitool -H <IPMI IP> chassis power off

The problem for home users is that most consumer grade hardware will not have these features since the IPMI is an actual computer that sits on your motherboards (either directly or in some sort of expansion slot). I will now describe what I did to get a similar (but heavily reduced feature set) for my home server.

Hardware

Computer

First of all you need some hardware, this could be any small computer that will fit inside of closely to your existing server. Its also very good if it could get power from the USB port of the actual server, this way you will not have to have any separate power source for your of of band, also this will have ground in the two systems at the same level which will be good later on.

I use a OrangePi Zero and a case which I got off of ebay for about 10USD.

Console

Motherboards these days don’t have a external serial port anymore, but some of them have a internal one which mine luckily had. But to hook up the serial interface of the computer which is a RS-232 interface to the TTL serial interface of the OrangePi I needed to do some conversion or you will damage your Pi, I use a MAX3232 in a package from sparkfun to do this. Just hook upp RX/TX and GND (and 3-5.5V to power it) of both systems to the MAX3232 and you should be good to go. Notice: that if you use the primary serial interface of your Pi you can run into problems if both systems are booting at the same time, because they will interpret each others boot messages as input and will most likely hang the boot.

MX3232

Power control

This is one of the most important and also interesting parts of the project. To have console access to a server is pretty common and I have also described this in another “out of band” article where I use console access for my router.

But for this project I wanted to use the GPIO pins of my OrangePi to control the ATX power switch of my server. After some trial and error I got it to work. I use a transistor as a power switch and then I signal the transistor when I want to power on or off the system. A problem I had early on was that when the server (and then also the Pi) got power it immediately  turned on the server as well. This was a problem for me because of the console “bug” I described above. To work around this I added a couple of transistors to the system, first a 37kΩ resistor in front of the base of the transistor and also a 10kΩ pull-down resistor the get rid of any signal from the GPIO pin when it is not yet configured. The schematics of the thing looks something like this:

Schematics

This was built using:
Adafruit Perma-Proto Quarter-sized Breadboard
TIP120 transistor
a few pin headers and some resistors

and the end result looks something like this:

“Front”

“Back”

The lonely pin is where I connect the GPIO on my OrangePi and to the four other pins I connect the power push button on my case and the pwr+,pwr- pins on the motherboard.

The computer mounted inside my case looks loke this:

OrangePI IPMI

Software

To get the console output working from there server we need to change a few files. You will need something like this in /etc/ttys

ttyu0	"/usr/libexec/getty 3wire"	vt100	on secure

and something like this to /boot/loader.conf

console="comconsole"

I have not yet written any scripts and so on but it’s really easy to use use standard CLI commands in FreeBSD to control the GPIO.

# Setup of the pin
root@orangepi:~ # gpioctl -n 12 pwr
root@orangepi:~ # gpioctl -c pwr out
# Power on (if off)
root@orangepi:~ # gpioctl pwr 1 ; gpioctl pwr 0
# Soft shutdown (if on)
root@orangepi:~ # gpioctl pwr 1 ; gpioctl pwr 0
# Forceful shutdown
root@orangepi:~ # gpioctl pwr 1 ; sleep 5; gpioctl pwr 0

Summing up

This project took me about 3-4 evenings to finish including a lot of trial and error in the beginning and now I have a system where I can actually from a remote location reboot my server. I also get console access early enough to change the options to the kernel or even change kernel before booting. Since I spent only about 25USD in total on this project I’m really satisfied with the result. We will have to see how good it actually works in a real situation, like a kernel panic or whatever.

Strong authentication of OpenSSH hosts using hardware tokens

This article describes how to secure your SSH host keys using hardware tokens.

Background

I have previously written numerous posts about strong user authentication using smart cards, yubikeys and/or OpenSSH certificates. I have also described how you can use OpenSSH certificates to authentcate hosts. But let say your server where compromised in some way just for a few hours and your SSH host keys (and certificates) where stolen. This would allow the attacker to perform MITM attacks or impersonate your server in several different ways. Depending on the application this could be more or less detrimental. If the server have a lot of users this could be used to steal passwords for example.

One way to mitigate this attack is to store your host keys on hardware tokens. This way they cannot be stolen by someone not in physical contact with the server, and you would easily find out if the token was missing.

Configure the token

I will use a Yubikey 4 for this. I have already described how to use yubikeys for client keys, so a more detailed description on how to configure and use Yubikeys for SSH can be found here. You can check that everyting is working like this:

# opensc-tool -l
# Detected readers (pcsc)
Nr.  Card  Features  Name
0    Yes             Yubico Yubikey 4 OTP+U2F+CCID 00 00

What we need is basically a pkcs11 capable device i.e a smart card or “similar” and create a  RSA key pair on it.

Configure sshd and setting up a ssh-agent

Since it would be extremely impractical to enter the token PIN every time a client connects to your secure server, we will need to use a ssh-agent that will keep the pin in memory as long as the agent process is running. We also need to enter the PIN before we leave:

# ssh-agent -a /root/yubikey-agent
setenv SSH_AUTH_SOCK /root/yubikey-agent;
setenv SSH_AGENT_PID 10894;
echo Agent pid 10894;
# setenv SSH_AUTH_SOCK /root/yubikey-agent;
# ssh-add -s /usr/local/lib/opensc-pkcs11.so
Enter passphrase for PKCS#11: 
Card added: /usr/local/lib/opensc-pkcs11.so
# ssh-add -l
2048 SHA256:qBbMpdbUeabLe4PnfjrjPbGPu8zfbkbK+ni4mXOnV24 /usr/local/lib/opensc-pkcs11.so (RSA)

Now you have your RSA key available to the system using the UNIX-domain socket at /root/yubikey-agent.

In a production situation I would put this in a rc-script and enter the PIN at boot-time.

Configure OpenSSH

We need to  create a file containing the public key and also tell sshd to use this key and the newly created socket as a backend for its host keys.

# ssh-keygen -D /usr/local/lib/opensc-pkcs11.so > /etc/ssh/yubikey_host_key.pub
# echo "HostKey /etc/ssh/yubikey_host_key.pub" >> /etc/ssh/sshd_config
# echo "HostKeyAgent /root/yubikey-agent" >> /etc/ssh/sshd_config

Notice that if you have several keys on your token, ssh-keygen will output all of them. Make sure only the correct keys are added to the key file.

Verify the configuration

When you have configured sshd you will need to restart sshd and them we can verify that host keys are actually from the hardware token (in this case the yubikey). A very easy way to do this is to actually try to connect to the server and have a look at what keys it presents to you.

% ssh server
The authenticity of host 'server (172.25.0.15)' can't be established.
RSA key fingerprint is SHA256:qBbMpdbUeabLe4PnfjrjPbGPu8zfbkbK+ni4mXOnV24.
No matching host key fingerprint found in DNS.
Are you sure you want to continue connecting (yes/no)?

You can now easily verify that this fingerprint IS actually the same as the one ge got when we added the yubikey to the ssh-agent.

This is basically it. If you are going to use this in production you would probably want to add some rc-scripts to automate the setup process as much as possible.

Using SCRIPT_NAME in Flask standalone

This is a variant of the ReverseProxied solution from pocoo. As it depends on __call__ being called inside a wsgi environment, it does not work when the app is being run standalone with run().

ScriptNameHandler

We solve this by instead overriding the make_environ() function of WSGIRequestHandler inside a new class, ScriptNameHandler, and passing it as an argument to Werkzeug’s run_simple(), like so:

from werkzeug.serving import WSGIRequestHandler

class ScriptNameHandler(WSGIRequestHandler):
    def make_environ(self):
        environ = super().make_environ()
        script_name = environ.get('HTTP_X_SCRIPT_NAME', '')
        if script_name:
            environ['SCRIPT_NAME'] = script_name
            path_info = environ['PATH_INFO']
        if path_info.startswith(script_name):
            environ['PATH_INFO'] = path_info[len(script_name):]

        scheme = environ.get('HTTP_X_SCHEME', '')
        if scheme:
            environ['wsgi.url_scheme'] = scheme
        return environ

Then change

app.run()

to

app.run(request_handler=ScriptNameHandler)

Passing the http header X-SCRIPT-NAME to the app creates the value HTTP_X_SCRIPT_NAME in the environ variable.

Apache example

<Location "/test_subdir">
    ProxyPass "http://localhost:8081" 
    X-SCRIPT-NAME "/test_subdir"
</Location>