Inspecting NetFlow data with nfdump

This article describes how to inspect NetFlow which has been collected using nfcapd(1) from the nfdump toolkit with nfdump(1)

Background

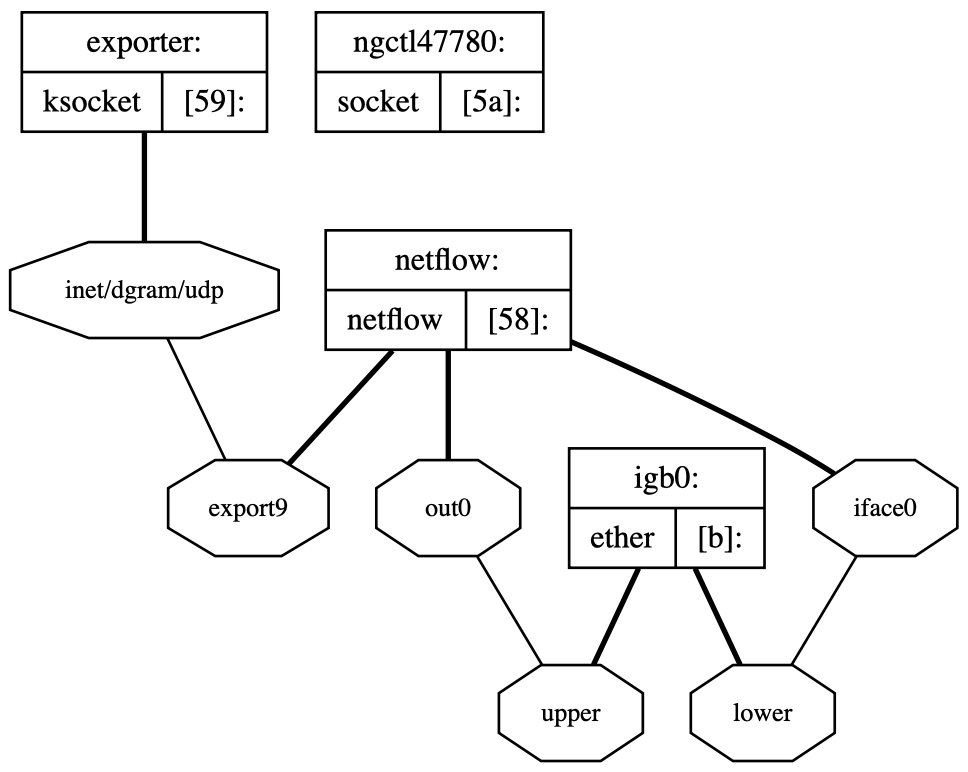
In the article Collect and save NetFlow data with FreeBSD I describe what NetFlow is and how to collect and store NetFlow using FreeBSD. But without an efficient way to inspect the data it is practically useless.

Using nfdump

nfdump uses a filtering syntax that is similar to bpf-syntax (the one tcpdump uses). This means that everyone familiar with tcpdump could get started rather quickly. For example:

$ nfdump -R netflow/ -o tstart -o extended 'host 172.18.37.34 and port 53'

Often you want to sort on a specific metric, for example “which hosts have the most traffic on port 53”, this can be done using the statistics option -s

$ nfdump -R netflow/ -s ip/bytes 'port 53'

Another really useful feature is aggregation. This can be used to aggregate all flow records over a specific set of parameters. The below example uses option -A to aggregate all flows where srcip and dstip are the same and then filters out a specific host of interest. In other words “Who has been talking to host x”

$ nfdump -R netflow/ -A srcip,dstip -n 20 'host x'

If you want to see flows for a specific timeframe you can use the -t option like this

$ nfdump -R netflow/ -s ip/bytes -n 20 -t 2019/01/21-2019/01/22

You can also change the output format to suit your needs. The formatting syntax are a little bit unintuitive (at least I haven’t seen it before) so you may have to reference the manual

$ nfdump -R /data/netflow/ -o tstart -o 'fmt:%ts %pr %sap %dap'

Flow records by them self have no sense of sessions and are unidirectional. If you want to see data for bidirectional flows you can tell nfdump to aggregate on bidirectional flows using -b or -B

$ nfdump -R netflow/ -A srcip,dstip -n 20 -B 'host x'

But please note that it is a guess.

This was a short introduction on how to inspect netflow data with nfdump. Please leave a comment if you have any questions or suggestions.

Collect and save NetFlow data with FreeBSD

This article describes how to export and collect and save NetFlow data with FreeBSD. In this article I will use the term NetFlow as a general description of NetFlow and similar protocols like sFlow and IPFIX.

Background

NetFlow was introduced in Cisco routers 1996 and is a convenient and cheap way of storing traffic metadata centrally. In its most basic form it stores information about: src ip, src port, dst ip, dst port, number of bytes and packets. Exactly what information that is captured depends on the specific version and implementation of Netflow.

Often NetFlow is collected on routers and switches in your environment. They are then exported to a central point for later use. These devices are called exporters. Exactly where you perform this operation depends on where you need visibility and on device capability. The flow records are then sent to a flow collector for later use.

Flow records can be used for a number of things such as network monitoring, billing, troubleshooting and digital forensics.

Flow exporter with FreeBSD

If a FreeBSD machine performs a network function such as a filtering bridge or router in your network you may want to also use it as a flow exporter in order to gain network visibility. The good news is that there is already support for this in the kernel together with the netgraph framework. I have honestly tried my best to understand what netgraph really is. My best description so far is that it is a framework for connecting different network functions in a arbitrary way (a graph).

To allow for generation of netflow records you need to load a few kernel modules: netgraph.ko, ng_netflow.ko, ng_ether.ko, ng_ksocket.ko.

# kldload netgraph ng_netflow ng_ether ng_ksocket

This is a basic example from the ng_netflow(4) manual. It creates a netflow node and routes all traffic to interface igb0 through it and then routes it back to igb0. The export side of the netflow node is connected to a ksocket node which is configured to send the netflow data to 10.0.0.1 on port 4444.

# /usr/sbin/ngctl -f- <<EOF
    mkpeer igb0: netflow lower iface0
    name igb0:lower netflow
    connect igb0: netflow: upper out0
    mkpeer netflow: ksocket export9 inet/dgram/udp
    name netflow:export9 exporter
    msg netflow: setconfig {iface=0 conf=7}
    msg netflow:export9 connect inet/10.0.0.1:4444
EOF

I have made a few changes from whats in the manual. Set conf=7 for the netflow node which tells it to export flows for both incoming and outgoing packets, by default it only captures incoming packets. Also I have also used the export9 hook in order to export NetFlow V9 data.

To visualize this graph you can use the command “ngctl dot”. This is how my resulting graph looks like:

ngctl dot

Flow collection with FreeBSD

There is several softwares that can be used to collect flows on a FreeBSD machine. In the past I have used rwflowpack which is part of the “SiLK stack” from CERT NetSA. While it is very powerful it can be a little bit overkill for smaller networks. So these days I have moved over to nfcapd which is part of the nfdump toolkit. You can install it from the package collection:

# pkg install nfdump

Running nfcapd is very straight forward. This example accepts flow records on port 4444 and stores them in /usr/netflow/. -S -w and -t has to do with the rotation of saved capture-files.

# /usr/local/bin/nfcapd -S 1 -w -t 3600 -D -l /usr/netflow/ -p 4444

Inspect the flow data

Reading flow data can be done using the tool nfdump. You can find my article about it here: Inspecting NetFlow data with nfdump

Make these changes permanet

How to make these changes permanent or applied at boot is beyond the scope of this article but there is several good descriptions on how to write rc-scripts for FreeBSD out there, for example the official docs https://www.freebsd.org/doc/en/articles/rc-scripting/article.html